

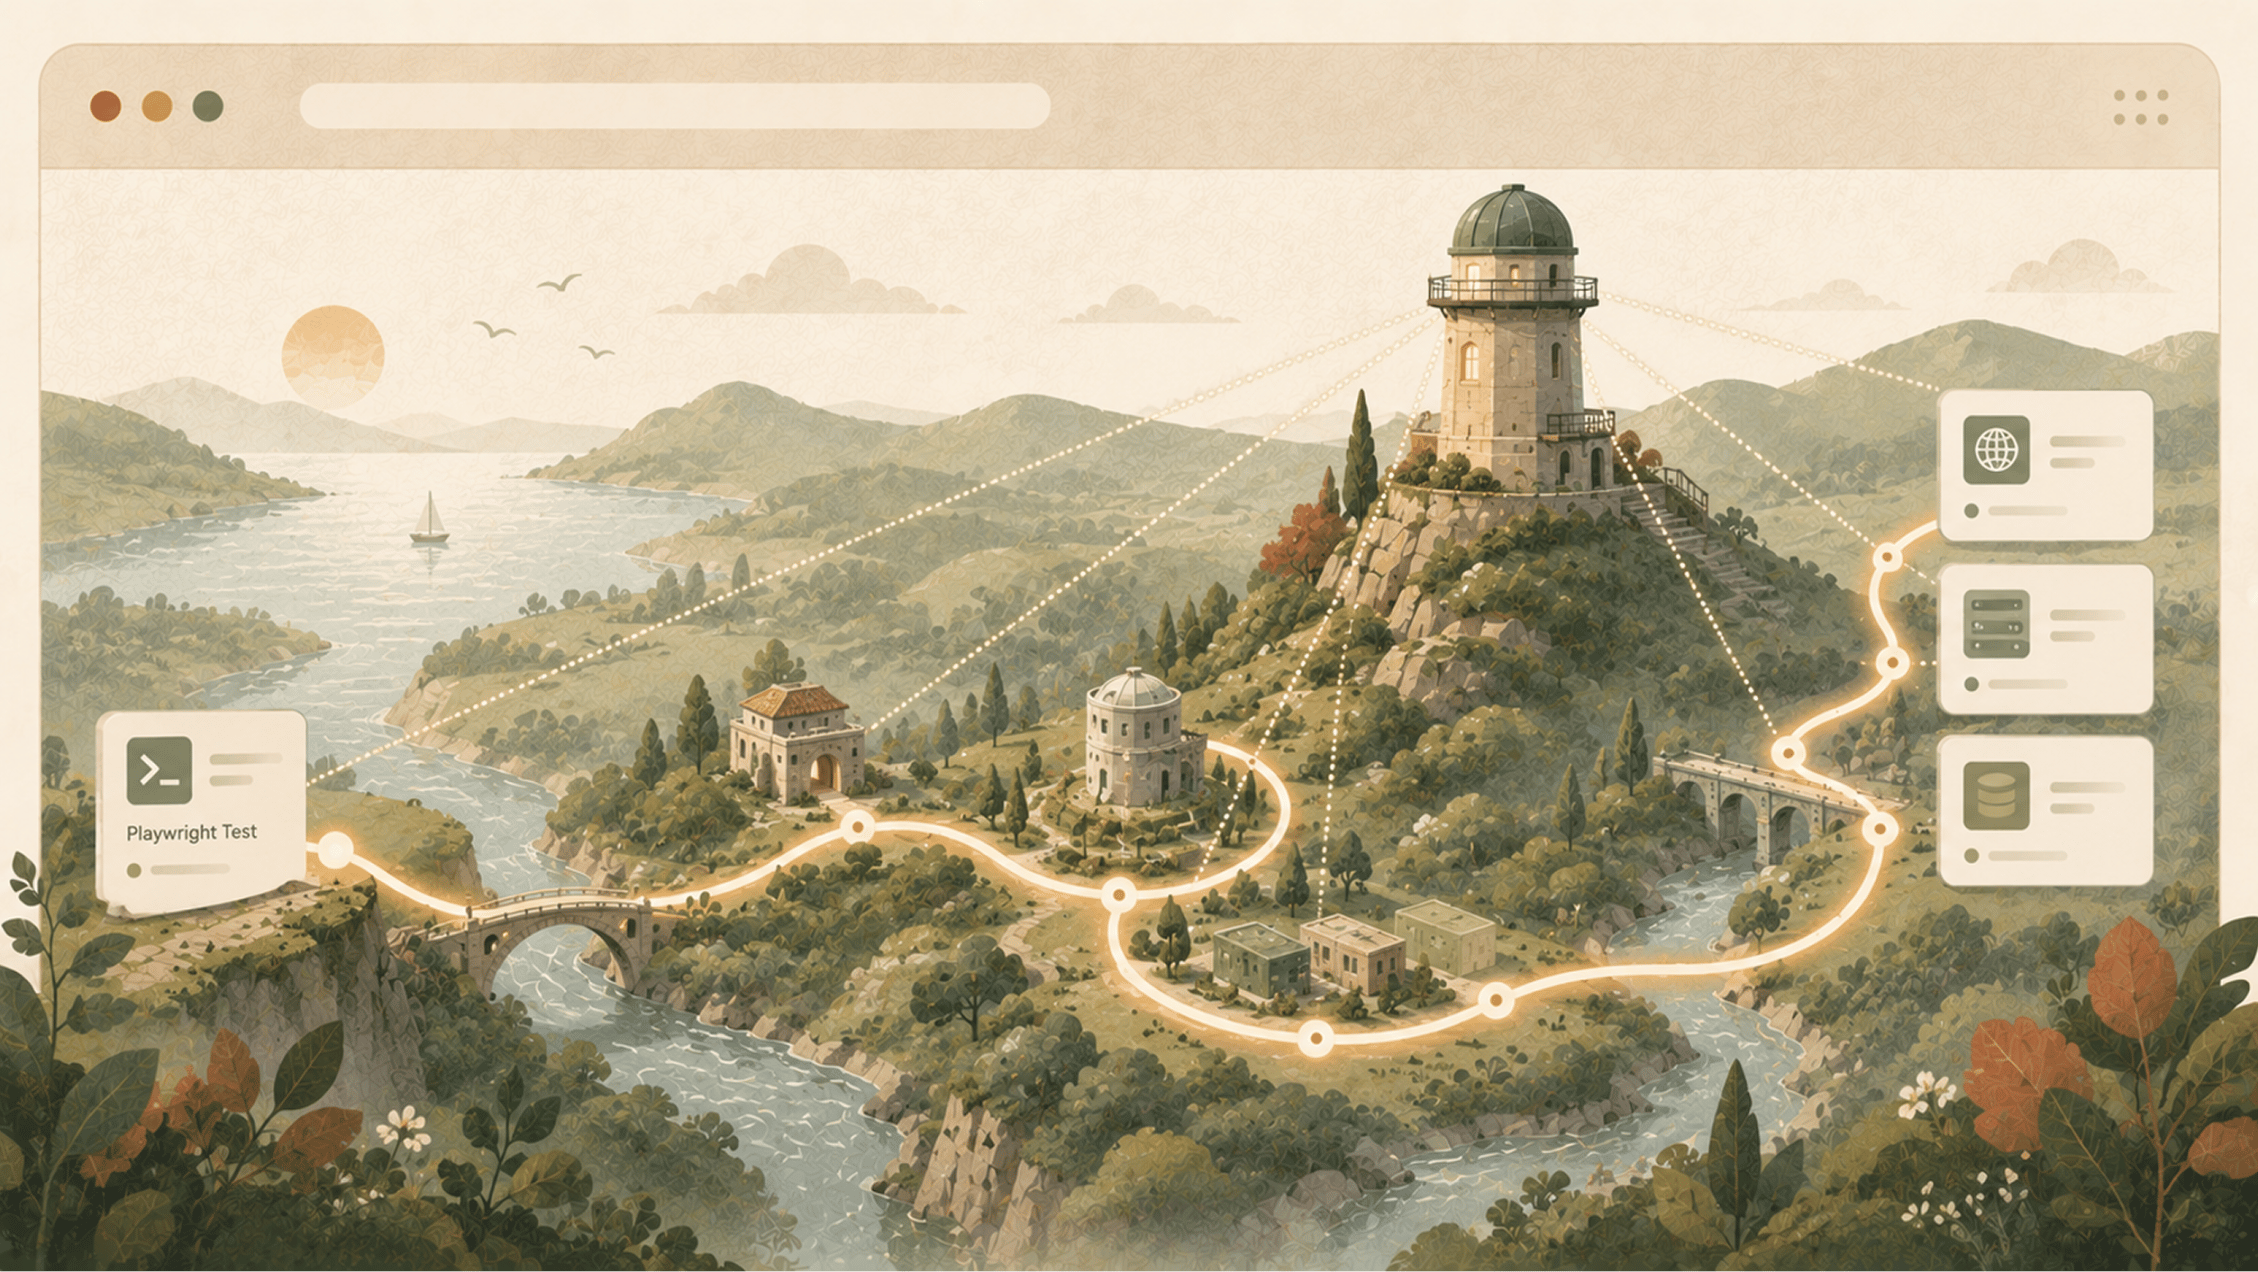
A Playwright test clicks “Create project” and waits. The button shows a loading state, times out, and fails.
You open the Playwright trace, and it shows the click, the spinner, the outgoing network request, and a final screenshot of a page that never finished loading. Every one of those details is accurate, and not one of them tells you why the operation failed.
The answer is somewhere beyond the network boundary, in an application log, a failed queue consumer, a stalled service, or a database query that never ran. To find it, you line up timestamps across a few tools, match a request ID, and guess at which log line belongs to your test.
The test did its job. It reproduced the failure on demand and deterministically in a known user flow. What it could not do was explain the failure, because reproduction without causality still leaves you guessing. The browser only tells half the story. The other half is happening in systems the browser never sees.
Introducing Playwright OpenTelemetry
The missing half becomes available the moment the test itself starts a distributed trace.
Instead of the test ending at the browser, it becomes the root of a trace that reaches every instrumented service the user journey touched. Most production traces begin with a single incoming request, which gives you a narrow view of one server-side interaction. A trace rooted at a test covers an entire known user journey, across many browser actions and many requests, and every one of them hangs off the same root.
The click, the browser request, the application handler, the downstream service call, and the database query all attach to a single trace, tied to the exact test attempt that triggered them. The failed “Create project” step is no longer an isolated screenshot. It is the top of a causal record you can read straight down into the backend.
Two pieces make that chain. A Playwright reporter creates the root span for each test attempt and turns steps, hooks, and actions into child spans. A Playwright fixture then injects that span’s context into the requests the browser sends. Your backend takes it from there. Any service already running OpenTelemetry reads the incoming context and attaches its own spans beneath the arriving request. Its instrumented database queries and downstream service calls then nest under those spans in turn.
To close this gap, we built Playwright OpenTelemetry. It’s our open-source, Apache-2.0 project, and it records a Playwright test as OpenTelemetry spans, captures the browser activity around that test, and propagates W3C trace context from browser requests into your instrumented backend.
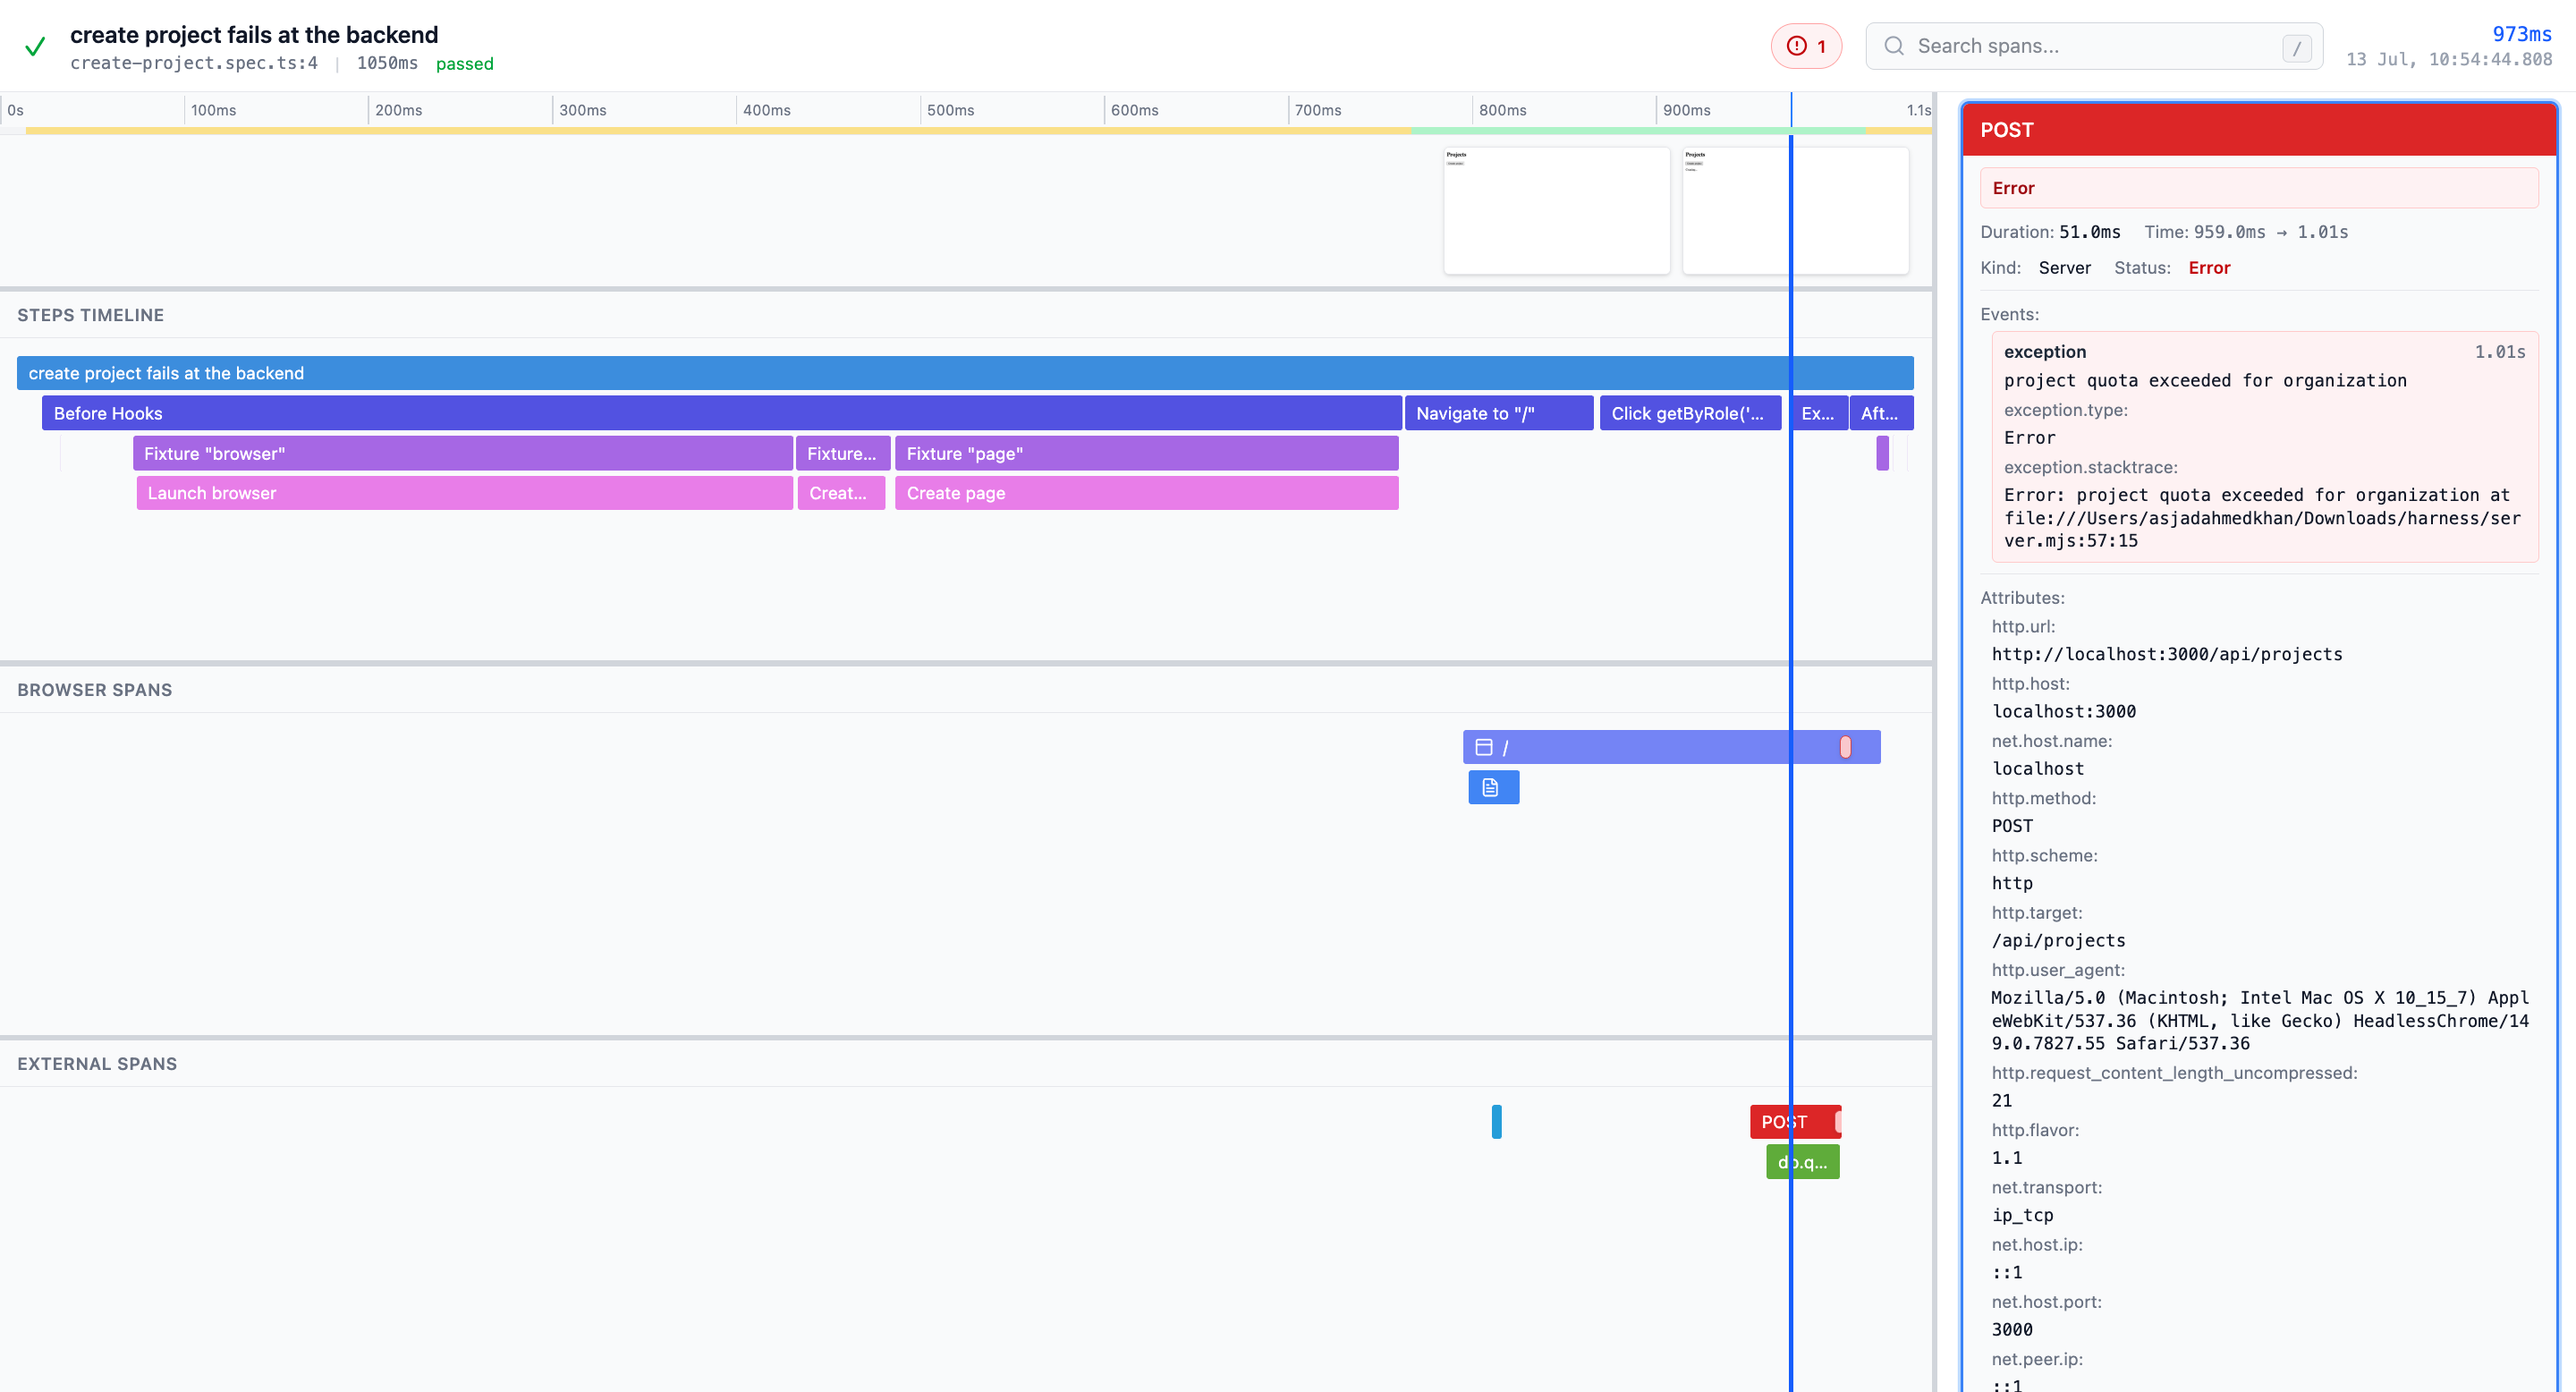
The result is one connected trace, shaped by a named test, that you can view alongside Playwright’s screenshot filmstrip. Playwright’s own tracing stays in place and keeps doing its job. The screenshots you already retain stay where they are, and the OpenTelemetry spans reach the places Playwright’s trace cannot.
The project is in early development and still on a 0.x release, so treat the sections below as a description of what works today rather than a finished product.
The reason to build it is simple. A test failure should not go opaque at the network boundary. You should be able to follow one deterministic user journey through the browser and into every service that handled it.
Before getting into how the pieces fit together, it is much better to be clear about why development is the right place to be doing this at all.
Production is too late to discover bad telemetry
Most engineers take a serious look at their OpenTelemetry data during a production incident, which is the worst possible time to find out it is not good enough.
OpenTelemetry usually lives in production. You instrument the application, ship it, and the spans start flowing once traffic arrives. So the actual shape and quality of your telemetry only becomes clear after deployment, at the moment you need it to diagnose something urgent.
That becomes prone to gaps. A span name turns out to be vague, the one attribute you need was never recorded, or an important operation left no trace at all. Fixing any of it means going the long way around. You change the instrumentation, deploy again, and wait for traffic before you can even tell whether the new trace is any better than the old one.
Watching traces during development closes that gap. You exercise a feature with an end-to-end test and examine the trace it produces. The feedback on your instrumentation arrives inside the same change that introduced the behavior, while the code and the reasoning behind it are still fresh.
A confusing span is something you fix now, not something you rediscover during an incident three months from now. The improvements ship to production for free, because development and production run the same instrumentation. OpenTelemetry gets more valuable the moment it becomes something you use rather than something your production systems emit.
That reframing raises a question. If you want to observe realistic distributed execution during development, what should be driving the system? End-to-end tests turn out to be a good answer.
End-to-end tests are repeatable probes
A good end-to-end test is the most natural place to observe a distributed system in action, because it already handles the hard part. It drives the application through a real user flow, on demand, the same way every time.
That is more than a unit test or a manual click-through can offer. A unit test stops at a process boundary. An end-to-end test crosses every boundary the user’s action touches, from the browser through the network to the backend services and the data stores. Manual clicking reaches those same boundaries, and an automated test adds three things on top: staying deterministic, being named, and being reviewable, so you can run it again tomorrow and get the same journey.
On top of that, it runs the application the same way it does outside the test environment, using the same OpenTelemetry instrumentation and exporters it uses everywhere else. You observe a realistic distributed execution without building anything artificial to trigger it.
We have written before that tests are durable descriptions of intended behavior. A Playwright test defines what should happen, and its trace records what actually happened throughout the system. Hold those two side by side, and you have a debugging artifact richer than either alone, one half stating the intent and the other showing the consequences across every service that took part.
Playwright test
    -> test step
        -> browser request + traceparent
            -> application request
                -> service call
                    -> database query
One trace ID runs the length of that chain, making the test a repeatable probe and spanning the evidence it brings back. Making that chain real is the job of the three pieces that the project ships.
Three parts, one trace
Playwright OpenTelemetry has three parts that combine into a single test-shaped trace. There is a reporter and fixture for Playwright, an OpenTelemetry Protocol (OTLP)-compatible Trace API that also handles Playwright’s screenshots, as well as a trace viewer built around tests. Each part is optional, so you can adopt as much or as little as fits your setup.
A reporter and fixture for Playwright
The reporter turns Playwright’s own lifecycle into OpenTelemetry trace data. Each retained test attempt becomes a root playwright.test span. Test steps, hooks, fixtures, and Playwright actions become child playwright.test.step spans. Test names, describe blocks, source locations, status, timing, and errors all become searchable trace context, so the trace carries the same structure you already think of when you read a test file.
The fixture supplies what a reporter cannot observe on its own. It records page navigations, same-document route changes, browser requests, Playwright request activity, worker fetch activity, console messages, and uncaught page errors. It groups those browser spans under a playwright-browser service, keeping them separate from your test and application spans.
The fixture also owns trace propagation, injecting a W3C traceparent header into browser-context requests early enough that instrumented servers honoring that header attach their spans beneath the request that caused them.
The fixture’s reach stops at the browser. It propagates context into the browser’s requests, and every span deeper than that comes from your own services, continuing the context they received.
The split stays clean this way. The reporter understands the test runner, the fixture understands the live browser, and your existing instrumentation handles everything past the network boundary.
An OTLP-compatible Trace API with Playwright artifacts
OpenTelemetry standardizes telemetry on purpose, and screenshots are not part of OTLP trace data. We wanted the trace itself to remain standard without discarding one of Playwright’s most useful debugging artifacts, so the Trace API keeps the two concerns side by side. It accepts OTLP trace data, stores trace fragments in S3-compatible object storage, and exposes Playwright-specific endpoints for expected traces and screenshot uploads.
The reporter reuses the screenshots Playwright already captured in its retained trace rather than taking a second independent stream, and those screenshots travel as a manifest-backed sidecar ZIP rather than getting smuggled into span attributes. The viewer requests the standard trace data and the optional screenshot artifact separately, then aligns them by timestamp.
The underlying design principle is worth stating: keep the telemetry interoperable, then add domain-specific artifacts alongside it via a small, explicit extension.
The API is a customizable H3 library, so you can run it on Cloudflare Workers, Deno, Bun, Node.js, or any platform that supports web-standard request and response handlers. Built-in storage supports S3-compatible services such as Cloudflare R2, and you can supply custom storage by implementing the TraceStorage interface.
A trace viewer designed around tests
The hosted viewer and the self-hostable package both read OpenTelemetry trace data directly rather than a proprietary test-result format. The layout uses a time-aligned flame graph with a screenshot filmstrip above it.
That layout separates the trace into three views that match how you investigate a failure:
-
Test steps for the Playwright test, hooks, fixtures, and actions
-
Browser spans for navigation, routes, JavaScript, fonts, images, fetches, and other requests
-
External spans for your instrumented application and backend services
Console messages and uncaught browser errors appear as span events on the timeline.
From there, the viewer works the same way as the rest of your debugging tools. You search span names and attributes, inspect span details and events, jump between errors, and zoom into a time range, while the screenshots stay synchronized with the timeline and grouped by browser context and page. Anyone comfortable with browser DevTools, Playwright traces, or a production flame graph will recognize the layout; the three views share one screen because a cross-stack failure rarely lives in just one of them.
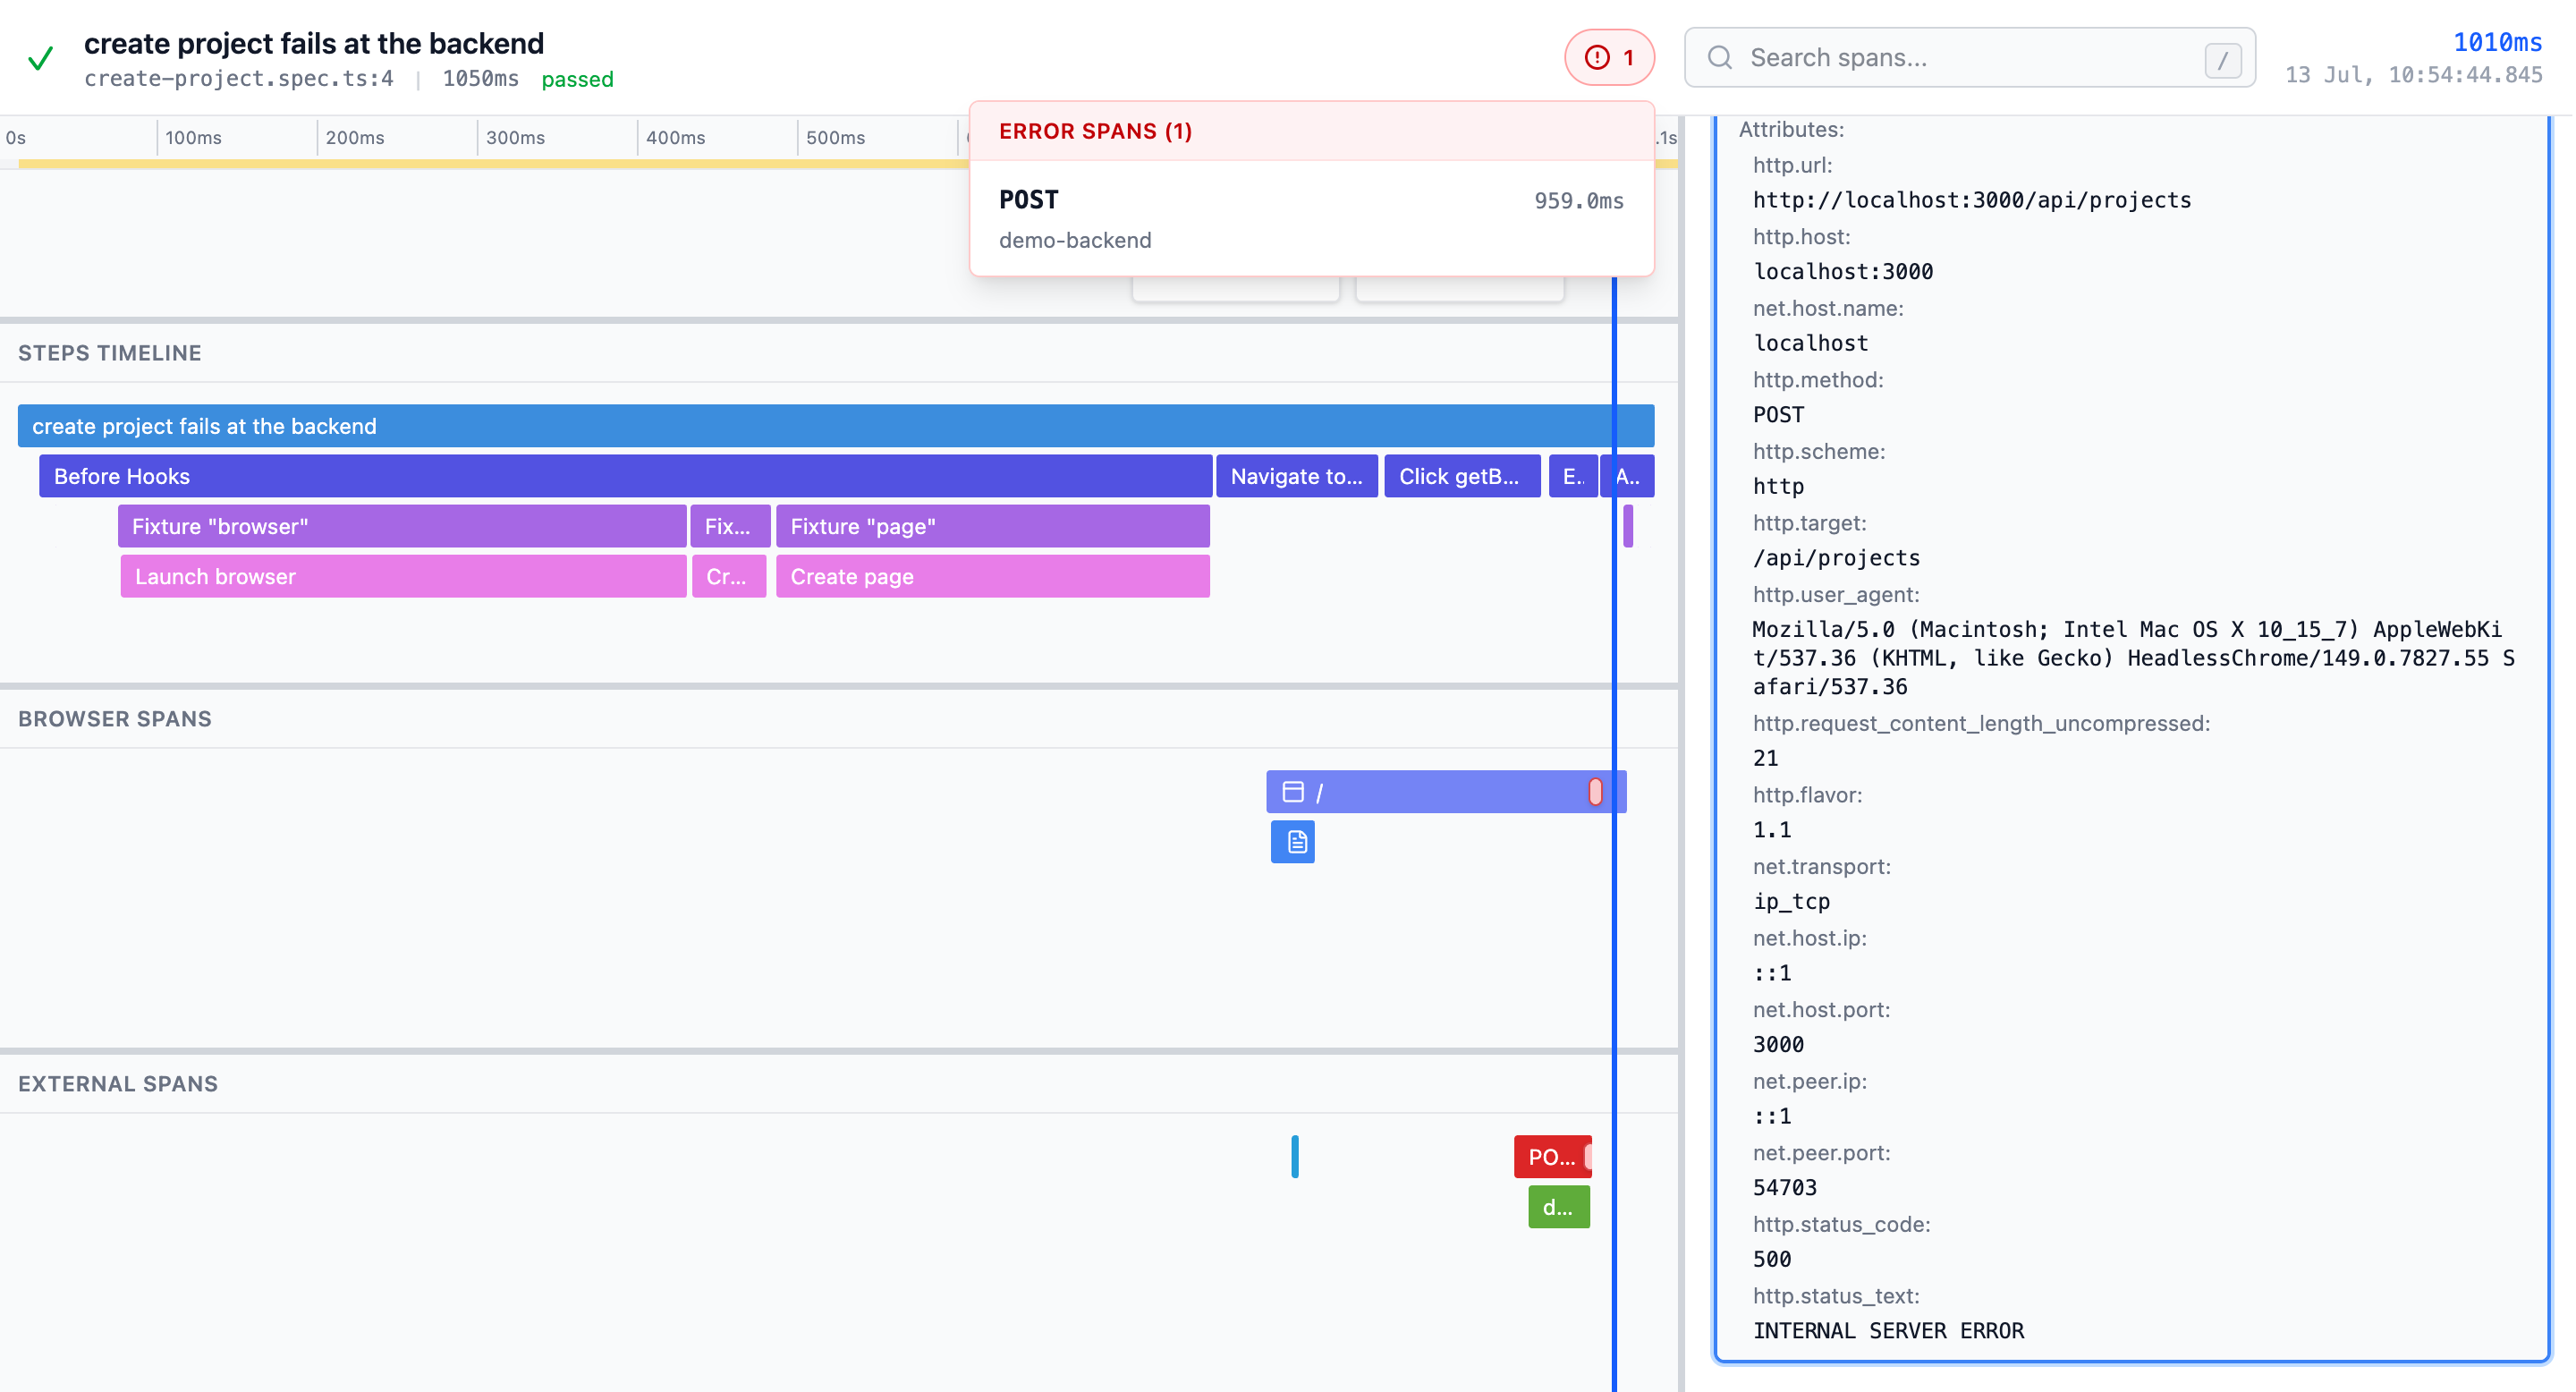
That combined view changes what you can ask of a failing test. The DOM and the screenshot show you the symptom. The distributed trace shows you the path that produced it, which means questions that used to require three tools now have one place to look:
-
Which browser request came from the failed Playwright step?
-
Which server-side span returned the error?
-
Did the expected database query actually happen?
-
Was the time spent rendering in the browser, waiting on the API, or inside a downstream dependency?
-
Which logs were emitted along the path?
-
Did a background service error out even when the browser only showed a timeout?
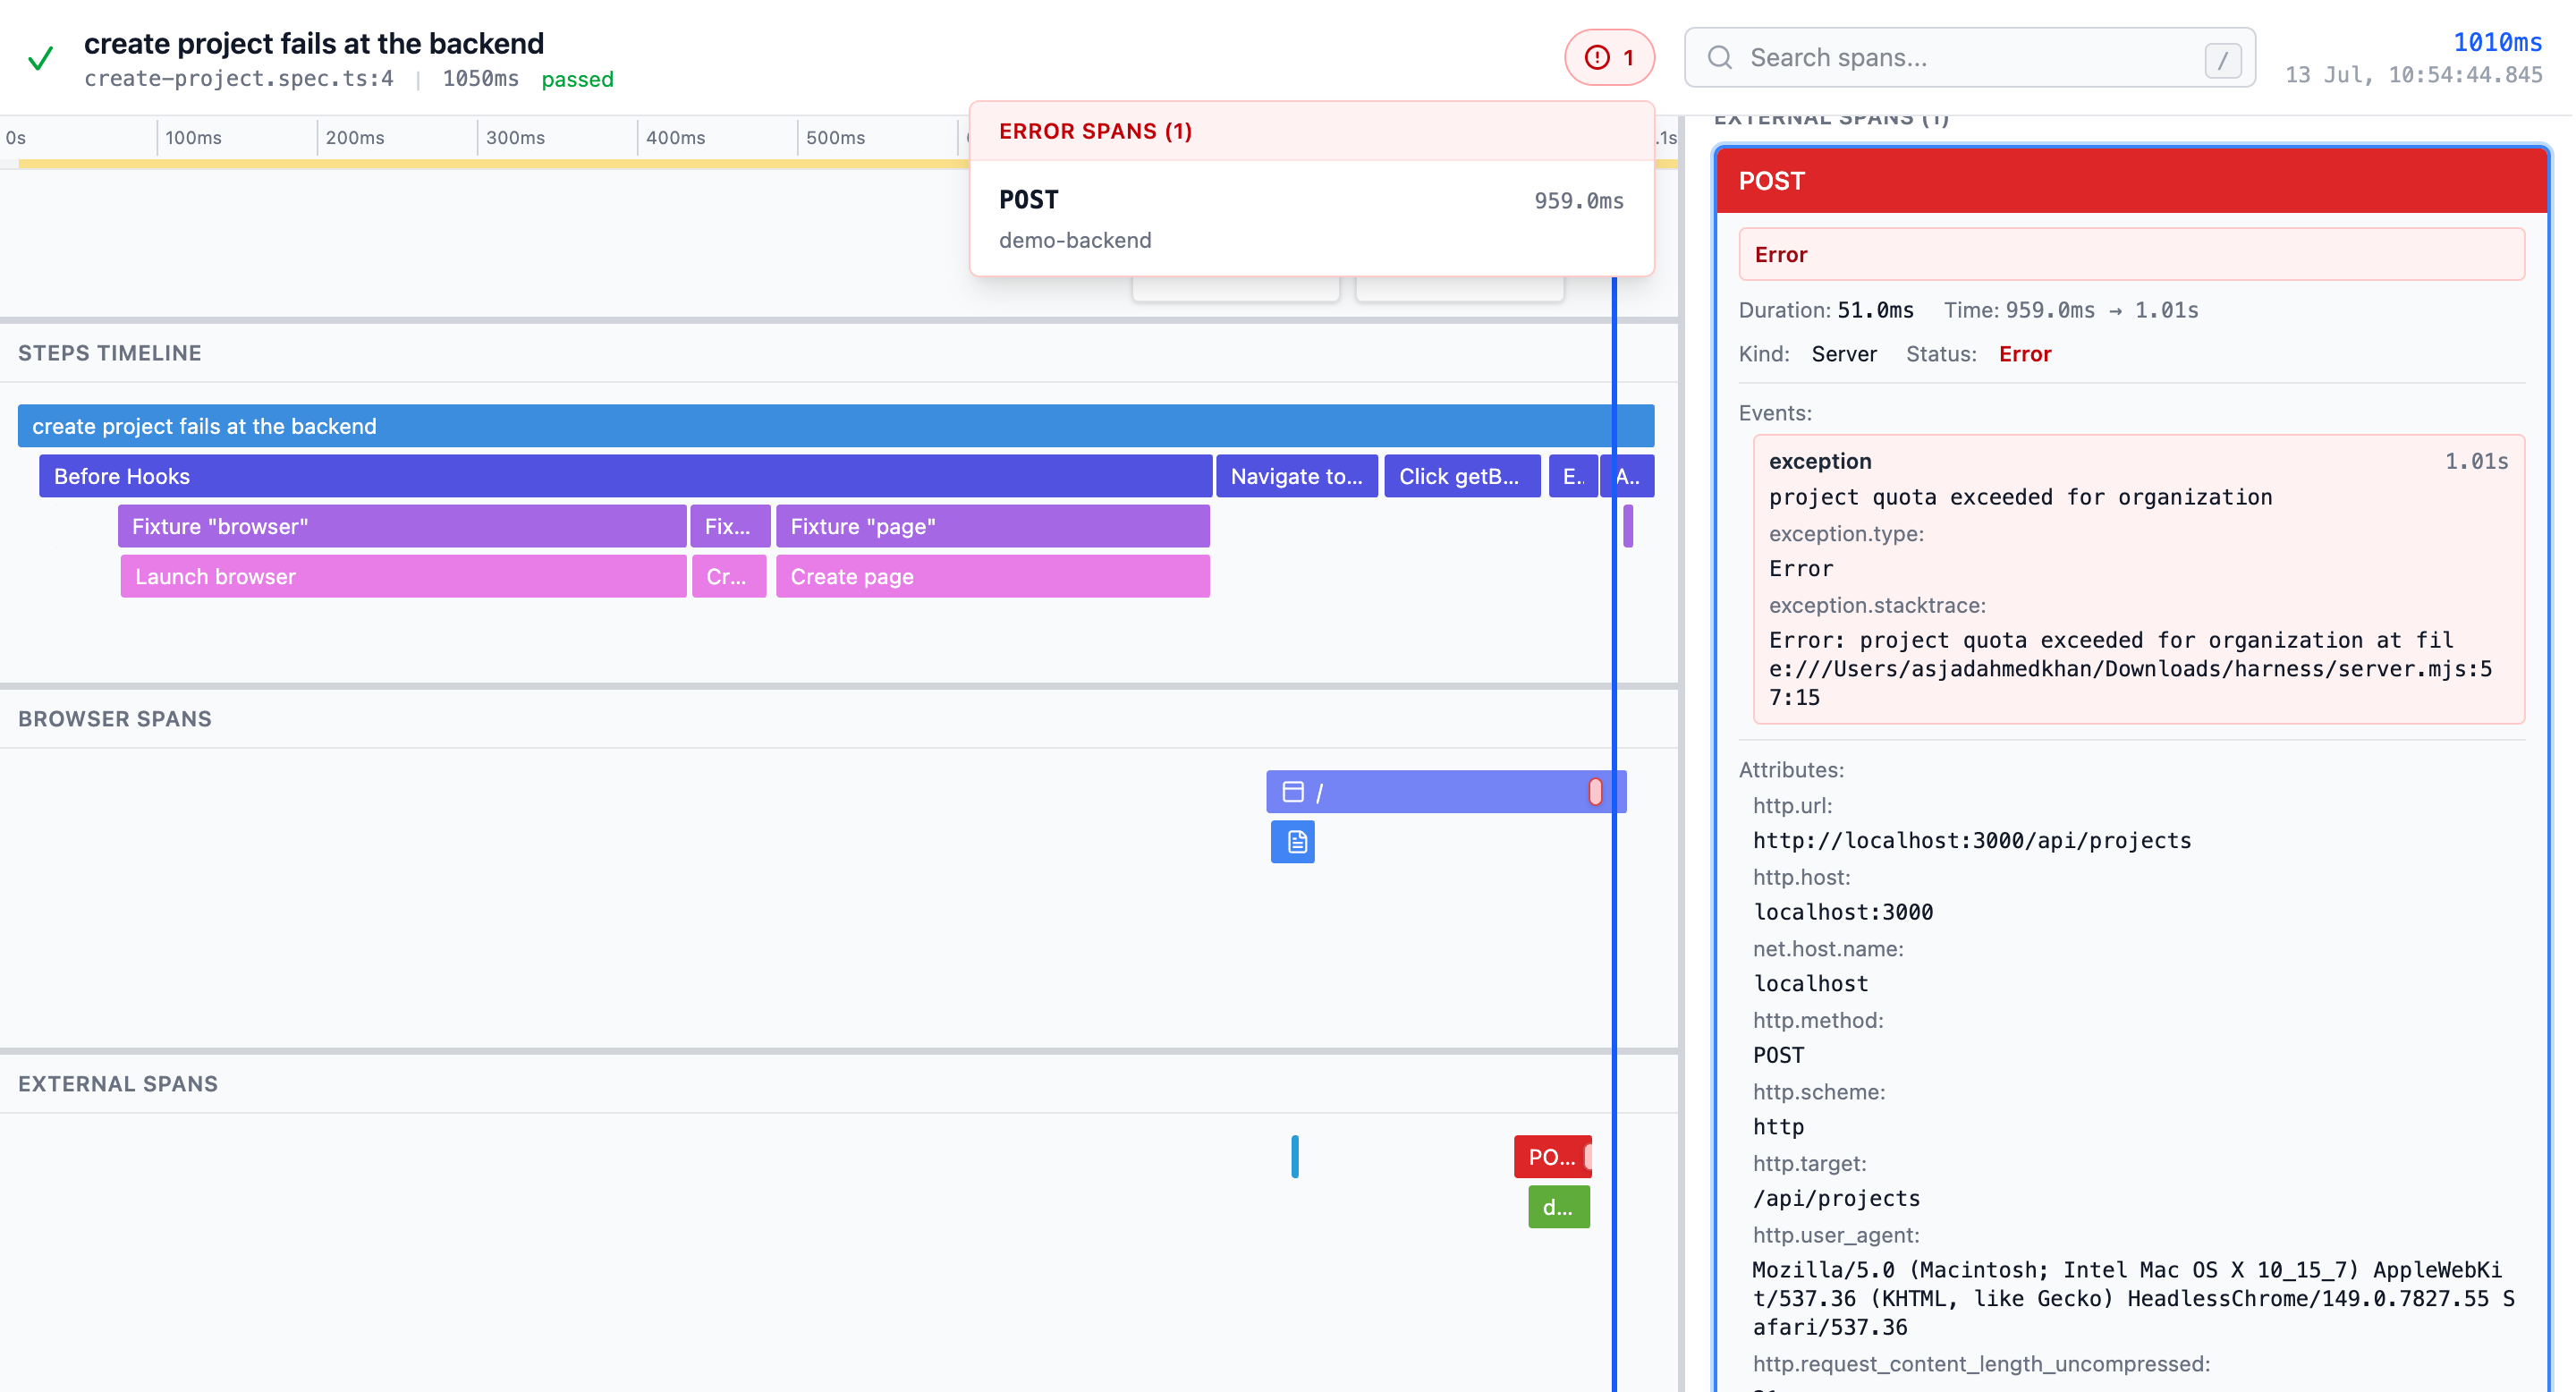
Answering those questions by hand is exactly the timestamp-matching work the opening example described, and a connected trace answers them by structure instead. That structure holds up outside the test run, too.
Use the same data model from development to production
A local test trace and a production trace should not need two different mental models, and with OpenTelemetry, they do not.
You learn the service names, span boundaries, attributes, and events while you build a feature. That same knowledge is what you reach for at three a.m. when production breaks, because the application emits the same instrumentation in both places. A confusing span in a test trace is an early warning that the production trace will confuse you too, and you fix it while the code is still open in front of you.
The portability comes from the protocol rather than from us. Send test traces to an OTLP destination you already run, such as Honeycomb, and they sit alongside your production data without a separate observability silo for tests. If you would rather not leave the machine, keep local ZIPs instead, or self-host the Trace API and viewer, or combine those options as your setup requires.
The current implementation sends OTLP/HTTP JSON payloads to configurable trace endpoints, so check that your destination accepts that transport before you wire it up.
Using the same tools in development and production is about the feedback loop. A shorter vendor list is a side effect. That structure turns out to matter for more than human eyes.
Better debugging material for humans and agents
The same connected trace that helps a human read a failure also gives a coding agent something it lacks. That thing is a bounded, machine-readable account of what one known test attempt actually did.
For a human, the path from a failed assertion to the answer is short. The screenshot leads you into the active Playwright step, which points to the browser request that carries the backend error and holds the relevant attributes. You never have to guess which events belong together, because the trace already groups them. The viewer makes that approachable through a visual timeline, and the underlying representation remains structured OpenTelemetry data.
Agents work under a tighter constraint. A browser agent normally sees the DOM, the accessibility tree, screenshots, and the actions it performed. All of that describes the visible surface of the application and says nothing certain about the systems that produced it.
A connected trace provides the agent with a clear account of the work performed by a single test attempt. It can inspect the server span’s status, events, timing, and attributes for the exact application programming interface (API) call that failed, instead of guessing at the cause. If a database operation was slow, the corresponding descendants are in the trace. If it never ran at all, they are missing, and that absence is itself the answer.
This works because OpenTelemetry is standardized and widely understood. The data model is not magic, and richer traces make an agent’s context better without making its diagnoses infallible. The deterministic Playwright test remains the stable execution mechanism, and the returned trace is what the agent explores, explains, and proposes improvements based on.
Whether the reader on the other end is a person or an agent, the setup to produce this data is simple.
Try it on a Playwright suite
Getting a trace from an existing suite requires a reporter, a fixture, and a choice about where the data goes. You add the reporter in your Playwright config, point it at an OTLP endpoint or a local ZIP, and switch your tests to the instrumented fixture.
import { defineConfig } from "@playwright/test";
import type {
  PlaywrightOpentelemetryConfig,
  PlaywrightOpentelemetryUseOptions,
} from "playwright-opentelemetry/fixture";

const playwrightOpentelemetry: PlaywrightOpentelemetryConfig = {
  // Send to any OTLP destination, for example, Honeycomb.
  // You can also set the OTEL_EXPORTER_OTLP_ENDPOINT environment variable,
  // which takes precedence over this otlpEndpoint if both are set.
  otlpEndpoint: {
    url: "https://api.eu1.honeycomb.io/v1/traces",
    headers: {
      "x-honeycomb-team": "your-api-key",
    },
  },
  // Or write a local OpenTelemetry trace ZIP instead of, or alongside, OTLP.
  storeTraceZip: true,
};

export default defineConfig<PlaywrightOpentelemetryUseOptions>({
  reporter: [["playwright-opentelemetry/reporter"]],
  use: {
    playwrightOpentelemetry,
    // Screenshots come from Playwright's retained trace.
    trace: "retain-on-failure",
  },
});
Two settings in that config do different jobs. The reporter and fixture produce and export the OpenTelemetry spans, which is where the test steps, browser activity, and backend spans come from. Playwright’s own trace setting controls Playwright trace retention and, by default, OpenTelemetry output follows the same policy. The screenshots in the filmstrip are pulled from the retained Playwright trace. To export OpenTelemetry spans independently, set playwrightOpentelemetry.trace; this can give you the full span tree for an attempt even when Playwright does not retain a trace, but there will be no screenshots alongside it.
Existing tests need one change: importing the instrumented fixture in place of the standard one:
import { test } from "playwright-opentelemetry/fixture";The usage guide covers the current configuration and retention options, including how to control OpenTelemetry output independently of Playwright’s own trace setting, so it is the place to check for anything beyond this starting point. Once you have a trace, open the ZIP in the hosted viewer, or run the viewer yourself:
npx @playwright-opentelemetry/trace-viewerThat boots the viewer on localhost:9294, ready to load a local ZIP or an API URL that serves telemetry.
Two things set the honest boundary on what you will see. Connected backend spans require services that are already instrumented and honor the propagated trace context, so the trace reaches only as far as your instrumentation does. Screenshots depend on Playwright retaining a trace for the test, which follows your use.trace setting.
Inside those boundaries, the core workflow is available today. The project is still moving on a 0.x release, and the most useful thing you can tell us is where the trace still goes dark.
Testing and reliability describe the same system
Good end-to-end tests already give you repeatable, realistic application flows. Good instrumentation already gives you a causal record of distributed work. These have long been treated as separate disciplines owned by separate people, and they describe the same system from two directions.
Joining them means a test can return more than pass or fail. It can return the evidence you need to understand what the entire system did during the run, thereby shortening the loop for fixing failures, identifying latency, and improving telemetry before production ever depends on it. It also gives agents a way to reason beyond the browser surface into the underlying systems. Playwright OpenTelemetry gives both disciplines a shared trace to work from.
If you want to see what that looks like on your own stack:
-
Try
playwright-opentelemetryon an existing suite. -
Open an example trace in the Playwright OpenTelemetry trace viewer.
-
Tell us which parts of your stack the trace can explain, and where it still goes dark.