End-to-end Playwright tests are easy to write and hard to trust
End-to-end tests are the easiest to write, and the hardest to run. Why is that?
Distributed systems are hard, live networks are messy. Many engineering teams struggle with slow, unreliable or flaky end-to-end tests. Even the best end-to-end testing tools like Playwright are not immune to these issues.
Many problems stem from how end-to-end test code is written or from real properties of the systems under test. Hydration errors and overloaded backend systems need to be observed to be understood and fixed.
We believe that our testing analytics tools need to be as powerful as our production observability tools. With Endform, you get three months of analytics and stored traces included in the cost of running your tests.
Playwright test reports that shows you what actually happened
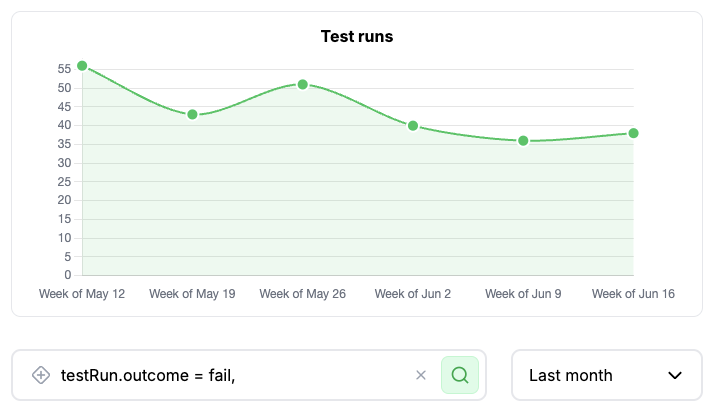
Playwright suite historical trends
Visualize test suite health over the last 3 months. Compare success rates, execution times, and failure patterns across different time periods.
Understand slow and flaky tests
Identify tests that fail inconsistently or run slowly. Explore data over time to keep your test suite healthy.
Inspect any past Playwright test run
We store your test run traces for you. Look back at any test run to see what happened. Or compare a current failure to a previous one to get to the bottom of what went wrong.
Turn Playwright test data into action
Stop guessing which tests are problematic. Get the insights you need to maintain a robust test suite.
Discover Endform's capabilities
Discover how Endform transforms your testing workflow
(Un)paralleled performance
Run hundreds of tests in parallel with unprecedented speed
Keep it green
Turn your test data into actionable insights
Come as you are
Bring your Playwright suite exactly as it is