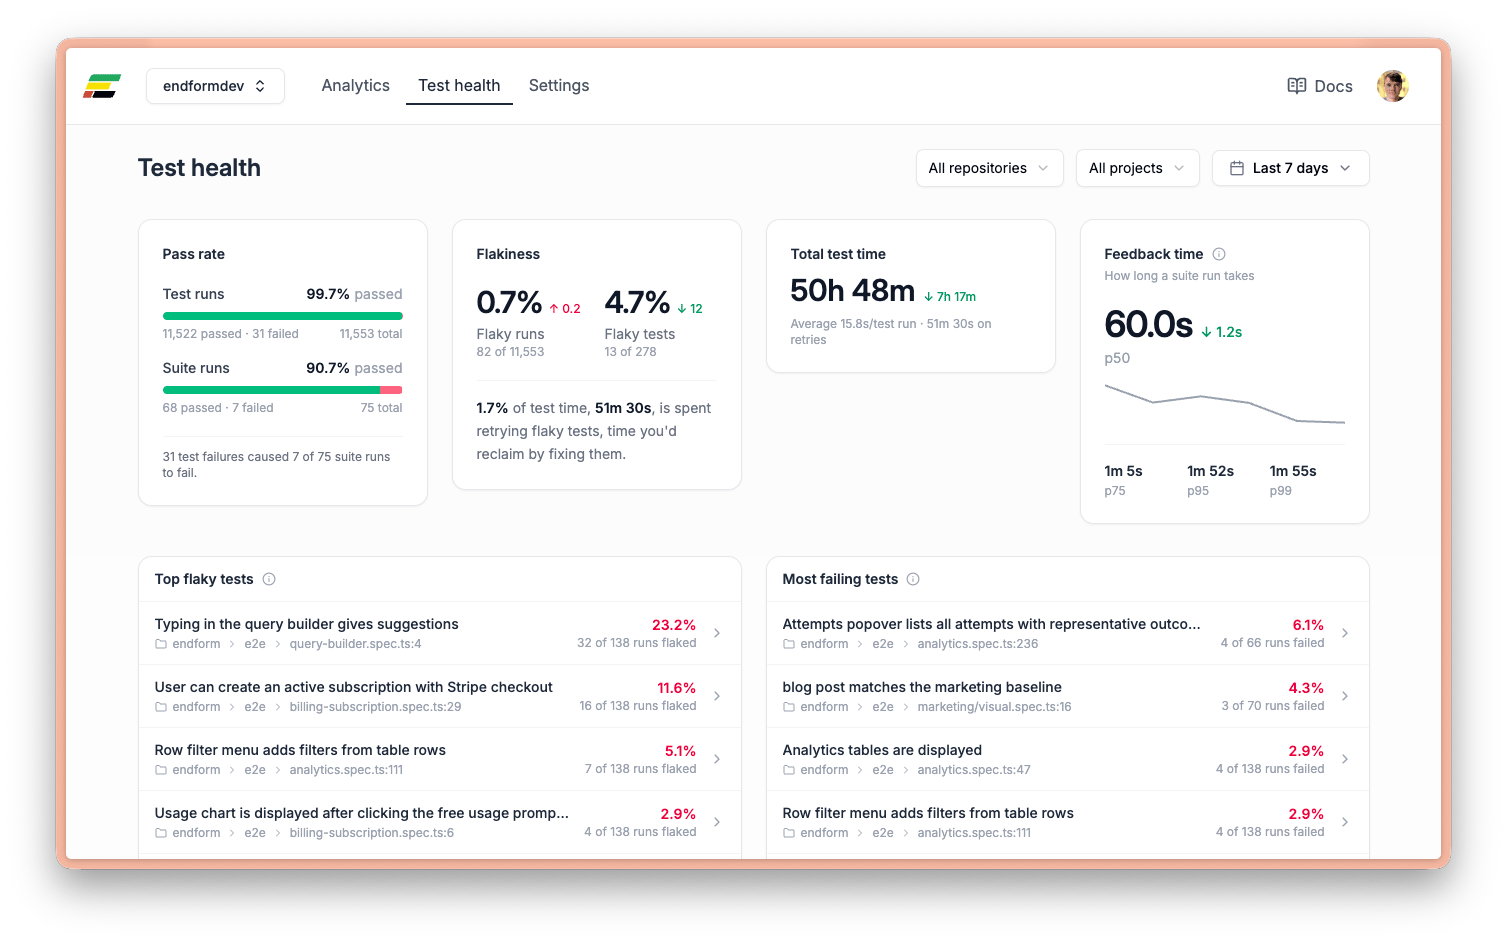
This summer, we shipped one of Endform’s biggest batches of releases yet: an MCP server that gives coding agents access to your test data and remote browsers, interactive Playwright debugging from the terminal, native Windows support, live suite runs in the dashboard, and support for pnpm’s Global Virtual Store.
Upgrade to Endform CLI 0.75.0 for all of the CLI changes in this roundup. Dashboard and service improvements are available automatically.
The Endform CLI now includes a local Model Context Protocol server. Connect it to your coding agent and the agent can move from a high-level trend, to the exact failed attempts, to the underlying OpenTelemetry trace, then start a remote live-test session against the test it needs to investigate.
{
  "$schema": "https://opencode.ai/config.json",
  "mcp": {
    "endform": {
      "type": "local",
      "command": ["npx", "-y", "endform@latest", "mcp"],
      "enabled": true
    }
  }
}
This example configures Endform in opencode.jsonc; setup instructions for Claude Code, Cursor, VS Code and other MCP clients are in the MCP server reference. The server uses saved endform login credentials or ENDFORM_API_KEY, and validates authentication during MCP initialization. Its tools cover the full investigation loop:
- Find trends with
query_analytics: Compare suite- or test-run counts, pass rates and average durations over time. Suite runs can be grouped by outcome or branch; test runs can also be grouped by test or project.
- Inspect executions with
query_samples: Fetch the concrete suite runs, test runs, attempts and error messages behind a trend. Test-attempt samples include trace IDs when a trace is available.
- Read traces with
get_otel_trace: Retrieve the raw merged OpenTelemetry trace for an attempt instead of stopping at its final error message.
- Debug remotely:
live_test_start, live_test_run, live_test_status and live_test_stop let an agent pause a single test, execute JavaScript in its Playwright scope and inspect the result.
Interactive Playwright debugging
The same debugging workflow is available directly from the terminal with the new endform live-test command. Start one test on an Endform runner, pause before a chosen source line, and run JavaScript with access to fixtures such as page:
endform live-test start tests/checkout.spec.ts:47 --line 72
endform live-test run <session-id> --code 'await page.getByRole("button", { name: "Pay" }).click()'
endform live-test status <session-id>
endform live-test stop <session-id>
The test runs in the same runner environment Endform uses for suites. The workflow captures output, saves updated ARIA snapshots and returned artifacts, and reports the current session state, making it possible to explore a failure without repeatedly editing and rerunning the full test.
Analytics and samples from the CLI
Analytics is no longer limited to the dashboard. The new analytics and samples commands expose the same investigation workflow to scripts and terminals:
endform analytics test-runs --metric pass-rate --group-by test --where 'branch = main'
endform analytics test-runs --metric average-duration --group-by project --period 30D
endform samples test-runs --where 'testRun.outcome = fail'
endform samples test-runs --where 'testRun.testAttemptsCount > 1' --period 30D --limit 25
Test-run samples include ordered attempts, errors and trace IDs, and both sample datasets support cursor pagination when you need to continue through a larger result set.
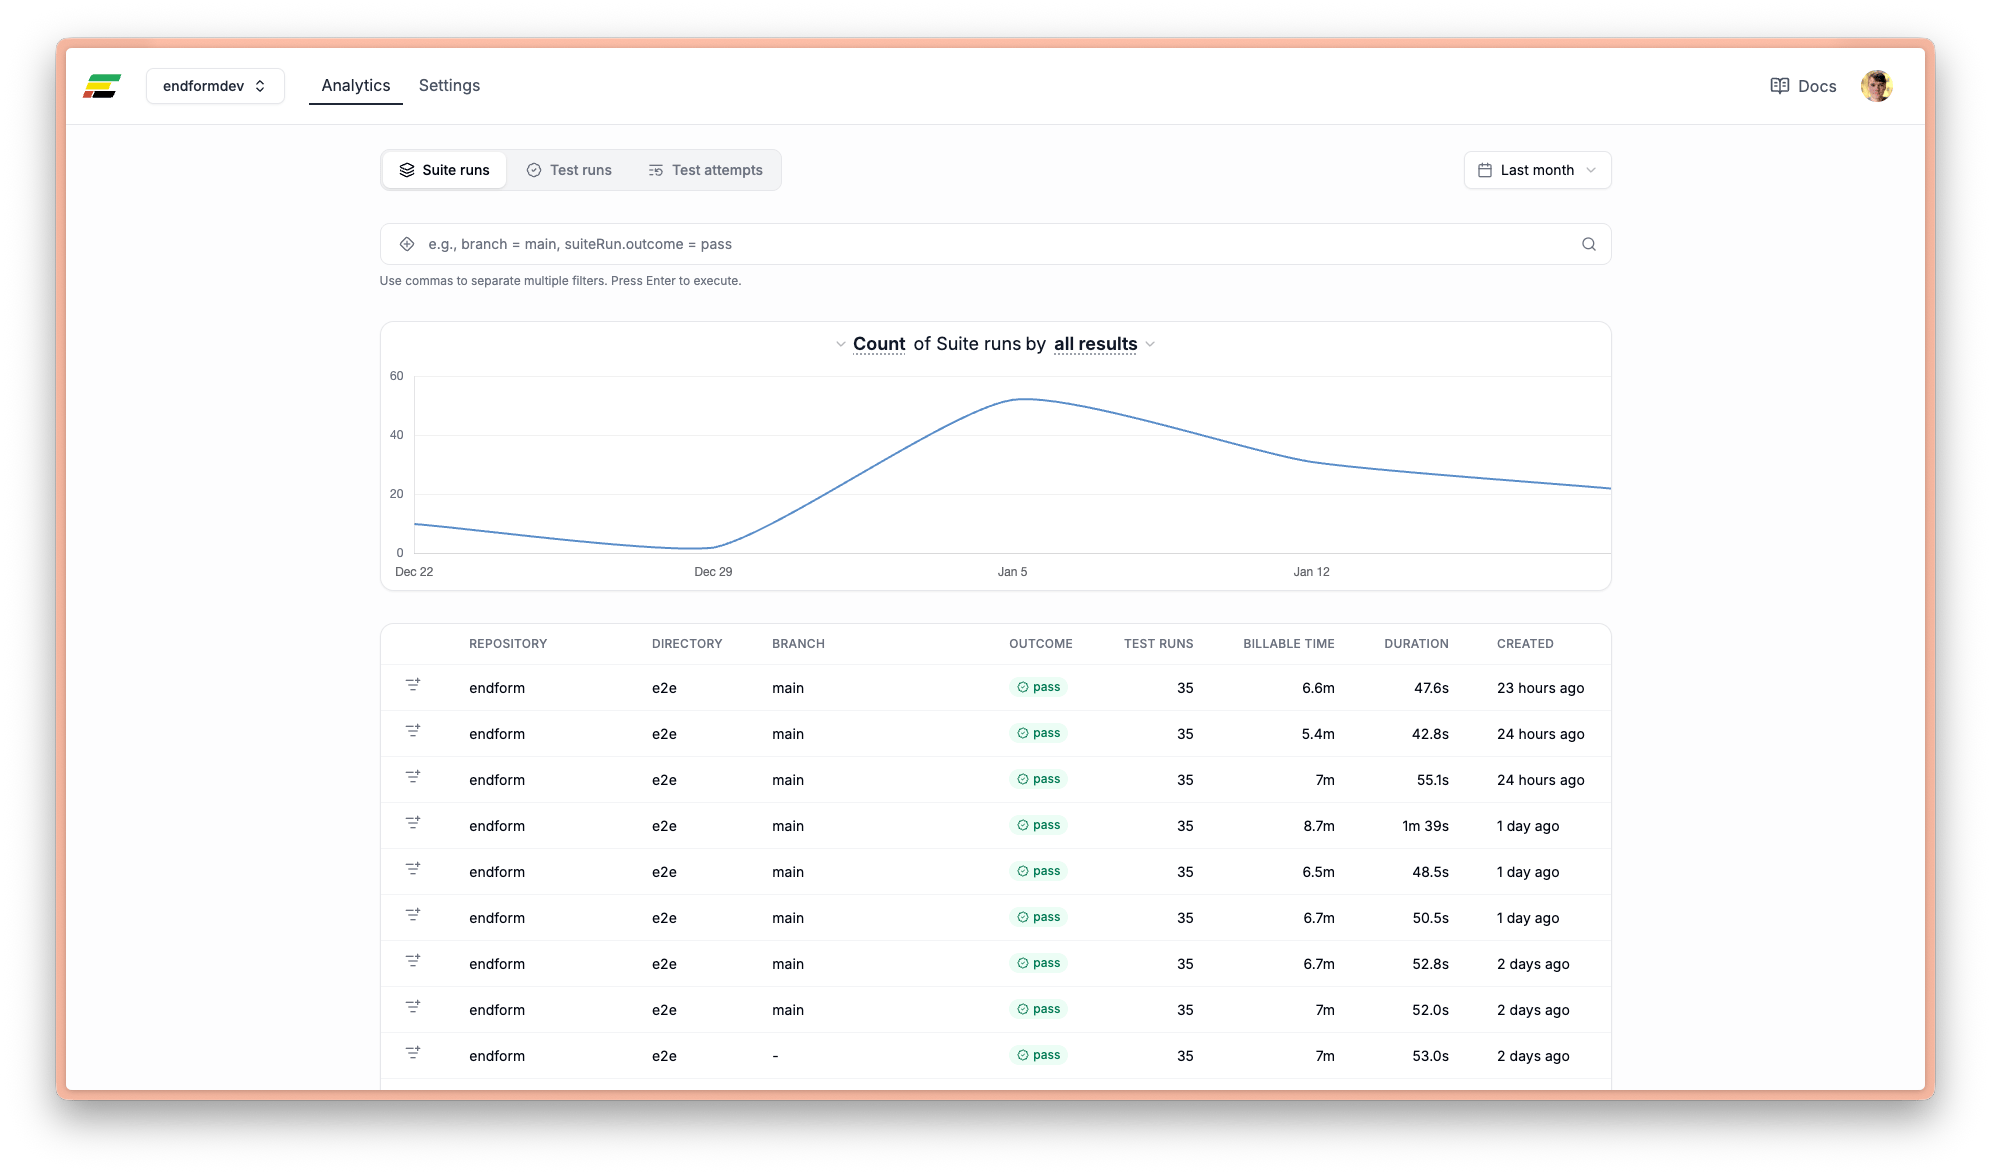
We also rebuilt the dashboard query builder with keyboard-friendly suggestions, editable filter chips, dynamic values, clearer parser errors and a raw query mode. Average duration is now available for both suite runs and individual test runs.
Watch suite runs live
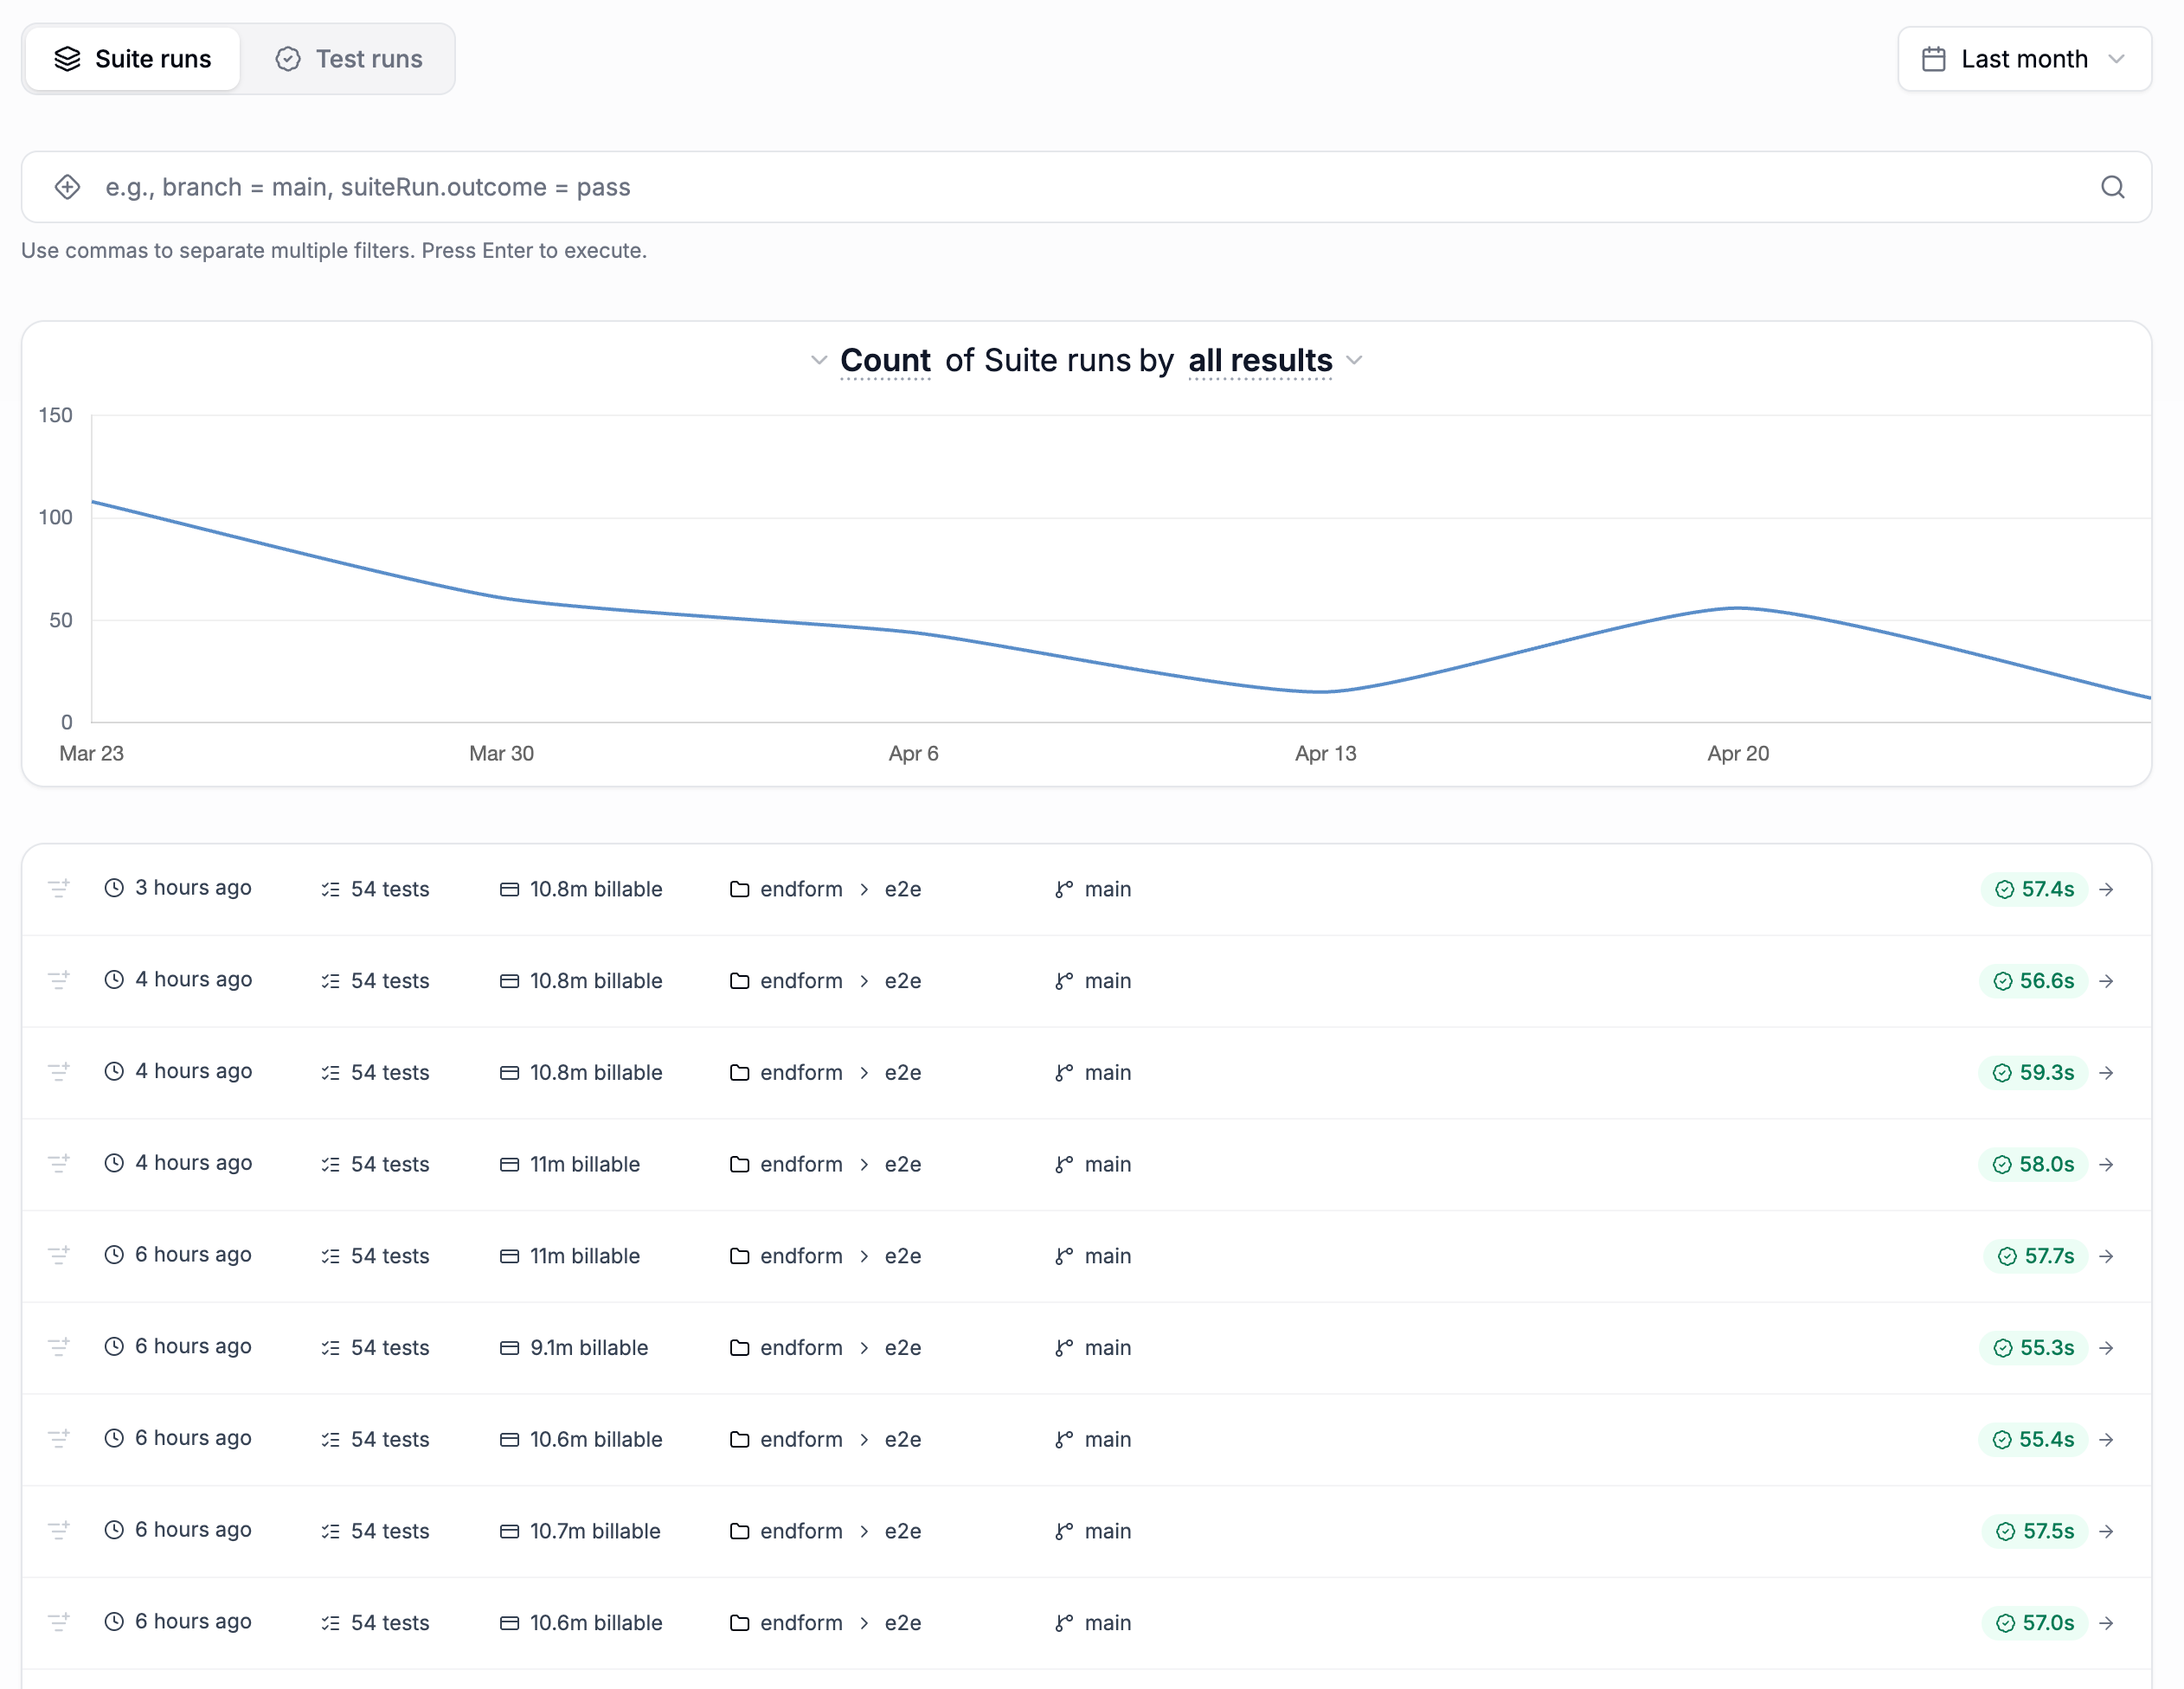
In-progress suites now appear in the suite runs table alongside completed runs and update while they execute. Each live row shows completed and total tests, running attempts, passed tests, tests awaiting retries, failed tests and the latest completed attempt, then refreshes into a completed row when the suite finishes.
Live rows can be turned off with the Live runs toggle. They are hidden automatically while table filters are active, because those filters currently apply only to completed runs.
Native Windows support
The Endform CLI now runs natively on Windows, with binaries published for both x64 and ARM64.
Playwright 1.62 and isolated retries
Endform now supports Playwright 1.62, including its new retryStrategy: "isolated" configuration. With isolated retries, ordinary tests finish first and retries are then run serially in a single worker, matching Playwright’s scheduling semantics on Endform’s remote runners.
pnpm Global Virtual Store support
Projects using pnpm’s experimental Global Virtual Store can now run on Endform. In this installation mode, package symlinks point outside the repository into pnpm’s global store. The CLI now rebases those dependencies into a portable internal layout while preserving package versions and peer-dependency graph identities.