As the time it takes to create code decreases, your continuous integration pipeline is rapidly becoming a bottleneck.
When writing code was slow, teams could tolerate slower feedback loops. A 10-minute CI run felt acceptable when it took you 2 hours to write the code. When an agent writes it in 5 minutes, that same CI run is suddenly 67% of your cycle time.
Have you tried reducing your CI cycle time from 10 minutes to < 5 minutes? You might find it deceptively difficult.
Marginal gains

In 2010, British Cycling’s performance director Dave Brailsford introduced the concept of marginal gains. They searched for 1% performance improvements in better pillows, heated shorts and hand washing techniques. Each individual change was both expensive and marginal, but the compound effects all added up. They won the Tour de France five times in six years.
The effect of compounding small improvements to repeated workflows like continuous integration is often undervalued.
Take a look at the calculator below to see how much time some small improvements might be worth to you. Many improvements might be no-brainers even though they feel like large expenses now.
Our complete deploy, check, and end-to-end test pipeline runs in under 4 minutes - worst case. Getting here took us many months and was the result of hundreds of small improvements.
The rest of this post is a collection of our favourite improvements you can make to your CI pipeline to reduce your cycle time.
Level: Easy
These are the quick wins. Most take less than an hour to implement.
Dependency caching
The easiest win in any pipeline, you’d be crazy not to do this.
- name: Install Node
  uses: actions/setup-node@v4
  with:
    node-version-file: ./package.json # Varies by stack, every language has one.
Same goes for .next/cache, Gradle caches, cargo target directories - whatever your stack produces that’s expensive to regenerate.
To improve cache performance, make sure that you’re using a good set of restore keys,
and that your main branch is producing regular fallback cache artifacts for new branches.
Basic parallelism
Normally your “base” checks like linting, typechecking, and unit tests don’t depend on each other. Use primitives like jobs in Github Actions to run them in parallel.
jobs:
  lint:
    runs-on: ubuntu-latest
    steps: [...]

  typecheck:
    runs-on: ubuntu-latest
    steps: [...]

  test:
    runs-on: ubuntu-latest
    steps: [...]
This is always one of the easiest things to do, but it’s also worth taking into consideration what the wall clock setup time for your setup is. If installing Node and your NPM dependencies is eating a majority of the time these jobs take, and they aren’t bottlenecking your pipeline, you might just be wasting resources.
Sometimes, running the linter and the typechecker in the same job is fast enough!
Better runners
It can often be easiest to simply purchase better performance. GitHub’s default runners are fine, but Blacksmith and Depot offer faster machines with better caching (often at a lower cost). Here at Endform, we have the fastest end-to-end testing infrastructure for Playwright on the market, if that’s your bottleneck.
Cancel in-progress runs
When you push a new commit, kill the old run. There’s no point finishing a pipeline for code that’s already stale:
concurrency:
  group: ${{ github.workflow }}-${{ github.ref }}
  cancel-in-progress: true
Level: Medium
These require more investment but can dramatically change your pipeline’s ceiling.
Globally shared caches
How much of the cache you’re restoring from can be used?
- If you can only restore from caches within a PR (poor restore key), almost none.
- If you can restore from the main branch, you can use a lot more.
- If you can restore from global caches, between developers machines and CI, the work that is left to do is minimal.
Tools like sccache for compiled languages or Turborepo’s remote cache let you share build artifacts across branches and team members.
Our experience when using these tools is that they need careful tweaking. Lots of parameters such as environment variables default to busting the cache. If you don’t take the time to configure these tools properly, you won’t be reaping the benefits of global caching and might even slow things down.
Dependency detection
The fastest pipeline is no pipeline. The simplest possible way to implement this is to only trigger on certain files:
on:
  push:
    branches:
      - main
    paths:
      - "apps/cli/**"
Normally this simpler view buckles under more complicated use cases like monorepo dependencies. When this happens, upgrade to a proper monorepo tool like Turborepo or Nx that can detect what actually changed and skip everything else.
turbo run build test --filter='...[origin/main]'In our opinion, working with dependency detection is one of the biggest long-term wins in this whole blog. It pays to start using a technique like this early, since it’s harder to retrofit to complicated systems.
Sharding tests across machines
If you have 100 tests that take 10 minutes sequentially, run them on 10 machines in 1 minute. Vitest and many other test runners have built-in support:
strategy:
  matrix:
    shard: [1, 2, 3, 4]

steps:
  - run: npx vitest --shard=${{ matrix.shard }}/4
As mentioned earlier, be wary of the installation setup cost when sharding. If it takes a long time to install your dependencies, adding more shards will give diminishing returns. If you’re interested in sharding Playwright end-to-end tests, we wrote about how we do it.
Level: Hard
These are more serious investments, and may take a little longer to get right.
Synchronized Job Dependencies
Particularly if you have jobs that are dependent on each other, waterfall-style dependencies might lead to a large amount of your wall clock time spent installing and setting up dependencies.
For our most dependent jobs, we instead trigger all jobs at the same time, communicate dependencies between jobs with artifacts.
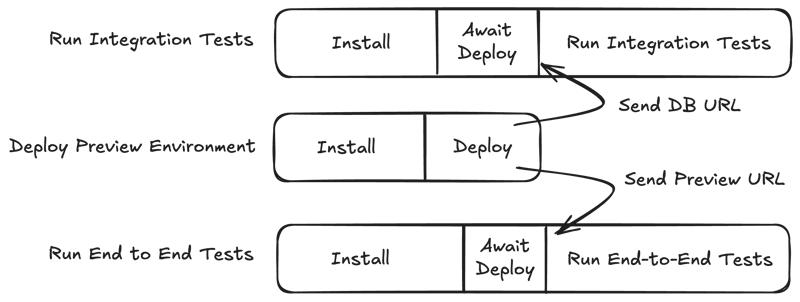
Without this, we would never have got our total wall clock time under 5 minutes. And even if some of these jobs spend some time waiting for other dependents, we find the trade-off worthwhile for us.
Doing this is tricky. We have to implement a custom action to figure out the difference between “rerunning all jobs” and “rerunning only failed jobs” on workflow retries.
Here’s a gist of the action we use to do this.
P95 speed, not average
It feels incredible when you can get most of your CI runs down to under five minutes. If 1 in 20 runs takes 15 minutes or unexpectedly fails, you will find that your overall experience still feels crap.
This is where your p95 speed and success rate become important. The kinds of problems and failures that you encounter at this stage will be highly individual to your setup. The only way you have of dealing with these problems is to start taking observability in your pipeline seriously.
You need to be able to see your most common failures and slowest runs over a longer period of time. All sorts of providers have offerings for this. From Datadog, to Blacksmith, to ourselves. Find something that works for you.
Once you’ve got something set up, it’s blood, sweat and tears from there. Don’t give up.
Radical change
A few final left-field ideas that might be worth considering when all else fails:
- CI providers that offer self-hosted runners have been popular for decades with good reason. If you own the instances, your repositories can already be installed, your caches are already warmed, and your dependencies already set up. For example,
node_modulescan be kept around and cleared ~once a week. The operational burden of this approach should not be taken lightly. - Switch out your stack. Within your ecosystem you might be able to switch out the tools you use for faster ones. Hell, if we’re taking it this far, why not consider switching programming languages to one that can offer faster cycle times? At the very least, it’s a metric you should take into consideration when choosing your stack.
Maintaining gains over time
However much you do today to improve your pipeline speed, it will be difficult to make your gains hold over time. We add more code, we add more checks, we add more tests. Gravity is working against us.
But as soon as you stop trying to make these investments, you will begin to slow down. And in the very same way that marginal gains will speed you up, marginal losses are the most sure-fire way to place you behind your competitors.
Move faster. Slowness anywhere justifies slowness everywhere. 2021 instead of 2022. This week instead of next week. Today instead of tomorrow. Moving fast compounds so much more than people realize.
Calculate your CI cost
Want to see how much slow CI is costing your team? Use the calculator below to find out - and see how much time it’s worth investing to fix it.