


You push a commit, open the pull request, and wait. The Actions tab sits there for three or four minutes before a single test runs. When the tests finally start, they go one at a time, and the job takes longer than the change you are shipping deserves.
If that is your pipeline, two things are usually to blame, and neither is your test suite.
The first is browser installation. Playwright ships its own builds of Chromium, Firefox, and WebKit, and the default workflow downloads all of them on every run. On a typical GitHub-hosted runner that is usually 300 to 500 MB of binaries and somewhere around 30 to 90 seconds of waiting, repeated on every push, for files that rarely change. The exact numbers shift with your Playwright version and runner, and the baseline run later in this piece clocks in at 42 seconds.
The second is parallelism. The generated scaffold pins CI to one worker by default, so left alone it runs your tests close to one at a time, even with cores sitting idle on the runner.
Both are configuration problems, not suite problems, and both have fixes you can apply in an afternoon.
And you do not need sharding for this. Sharding splits your suite across multiple parallel CI jobs, which is a real tool but answers a problem most teams do not have yet. For a suite of quick tests, caching your browser binaries and tuning parallelism gets you under five minutes on a single runner without sharding. Slower suites hit that ceiling sooner.
This piece walks through that setup end to end. By the end you will know where your time is going, have a workflow that gives useful feedback on every PR, and know the point at which sharding actually becomes worth it.
The baseline: what the default Playwright workflow actually does
When you run npm init playwright@latest, it offers to add a GitHub Actions
workflow for you. Most people say yes, and this is the file that lands in
.github/workflows/playwright.yml. It is the starting point for almost
everyone, so it is worth looking at closely before changing anything.
name: Playwright Tests
on:
  push:
    branches: [main, master]
  pull_request:
    branches: [main, master]
jobs:
  test:
    timeout-minutes: 60
    runs-on: ubuntu-latest
    steps:
      - uses: actions/checkout@v7
      - uses: actions/setup-node@v7
        with:
          node-version: lts/*
      - name: Install dependencies
        run: npm ci
      - name: Install Playwright Browsers
        run: npx playwright install --with-deps
      - name: Run Playwright tests
        run: npx playwright test
      - uses: actions/upload-artifact@v7
        if: ${{ !cancelled() }}
        with:
          name: playwright-report
          path: playwright-report/
          retention-days: 30
This works. It runs your tests and hands you a report. The problem here is that most of its time goes to the same setup and the same serial test run on every push.
Here is a real run of this exact workflow, on a public repo with a suite of about 40 tests. These are lightweight tests and run faster than most real-world suites, so treat the numbers as a fixed baseline for comparing each fix, not a prediction of your own run times.
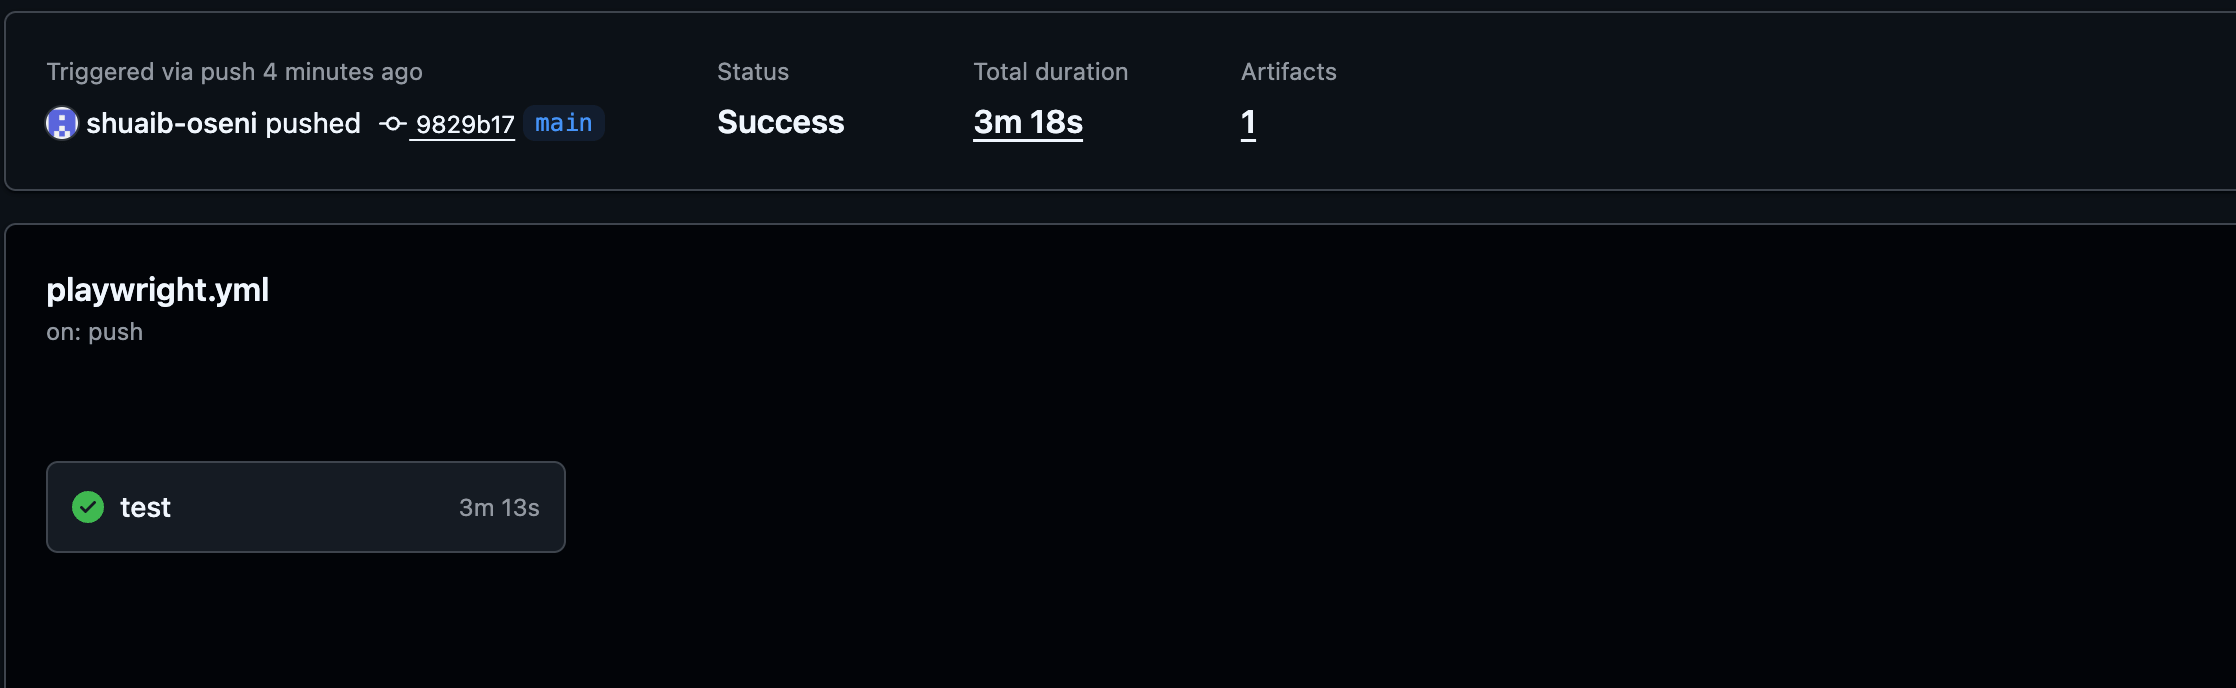
Three and a bit minutes for 40 tests. Now look at where that time actually went, step by step:
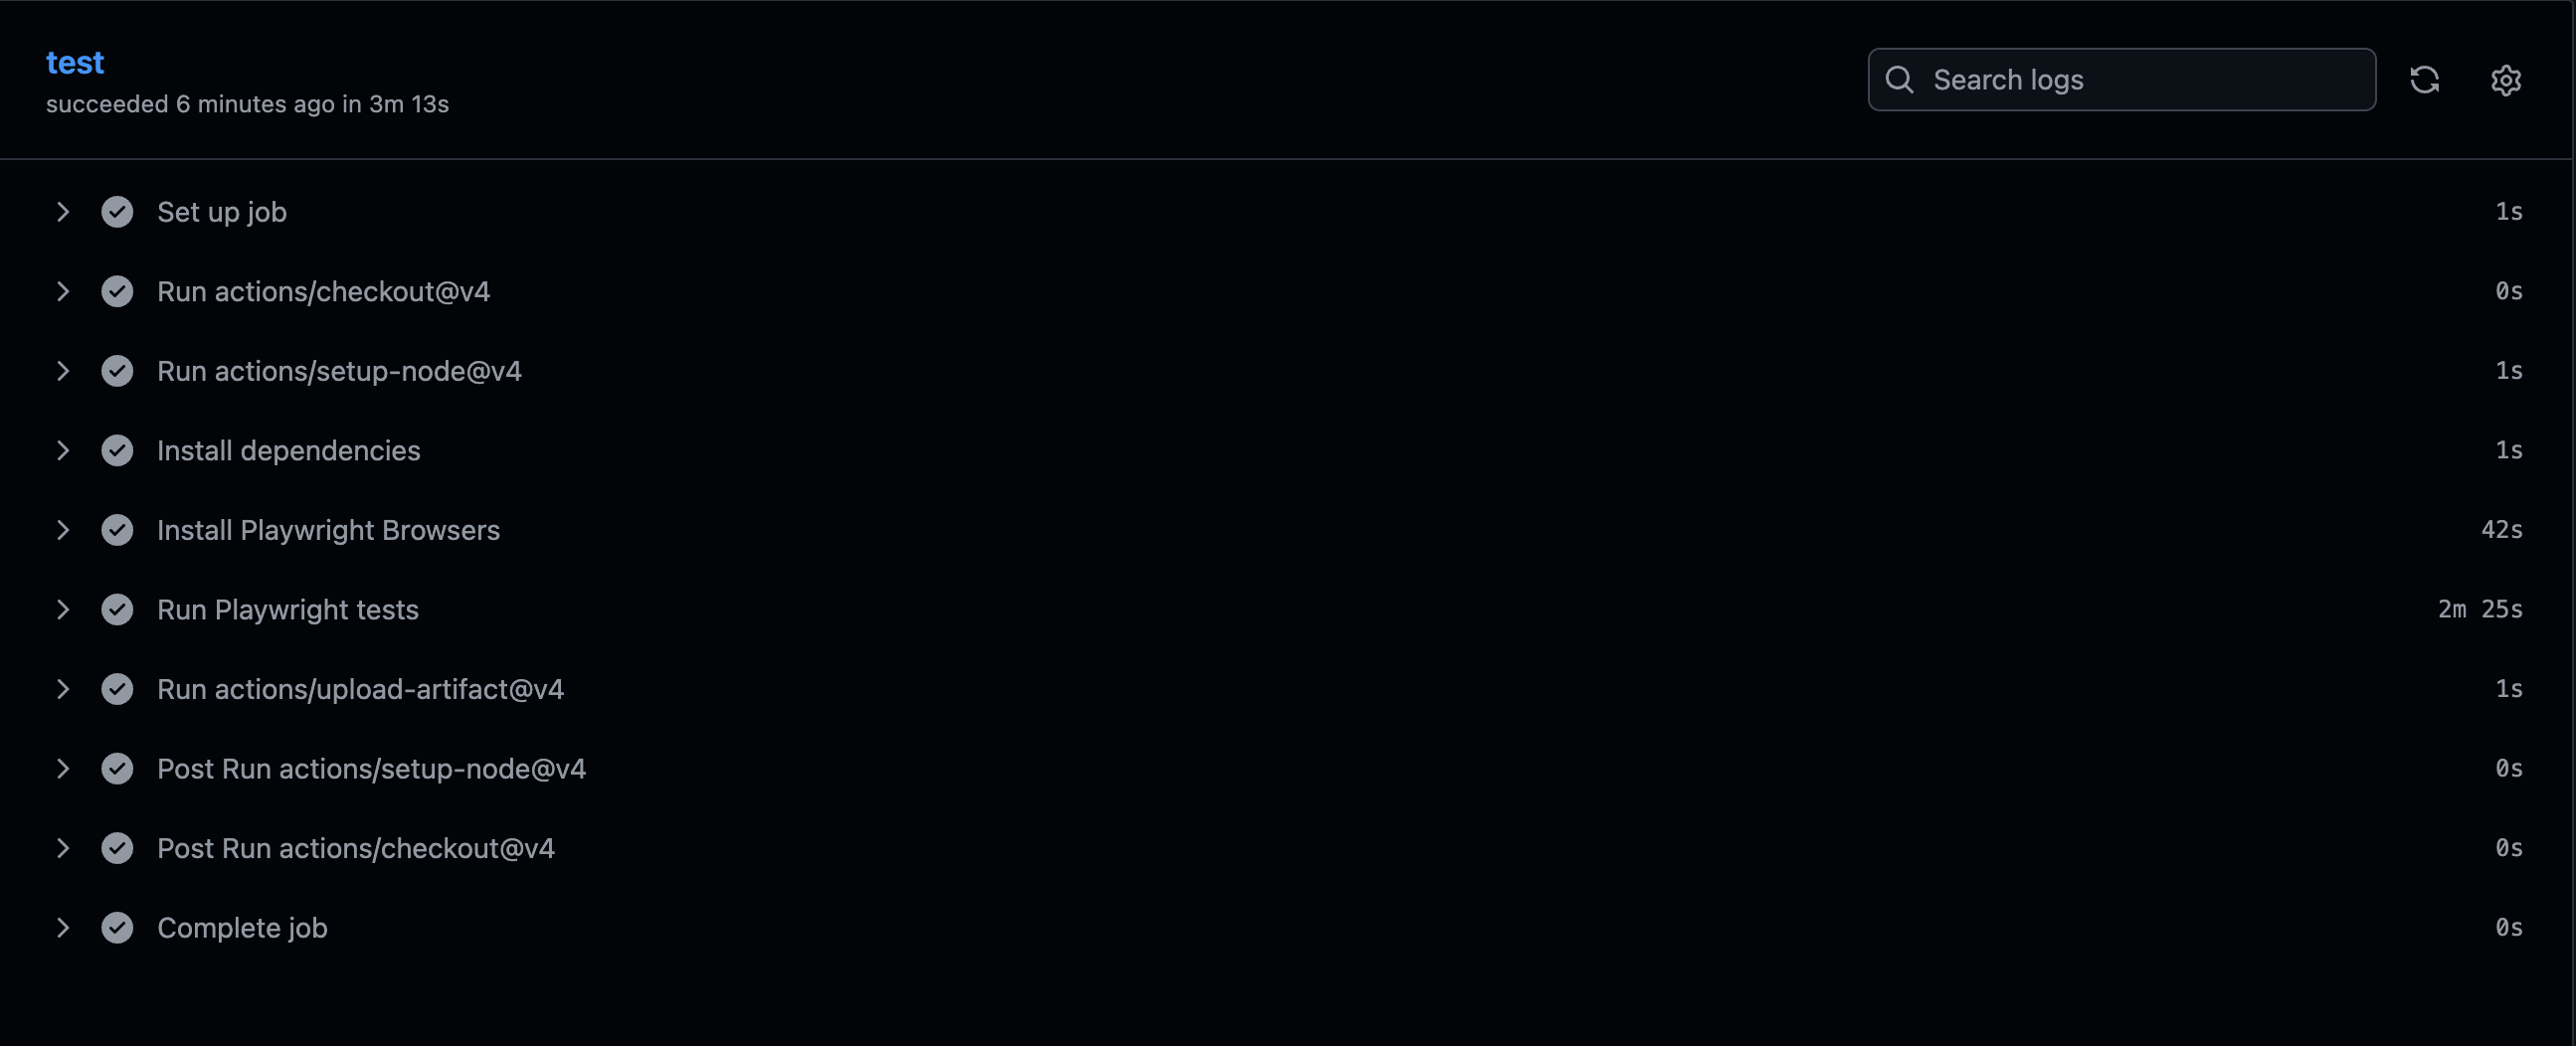
The cheap steps are genuinely cheap. Set up job, checkout, Node setup, and npm ci come in at zero or one second each. None of them is worth touching. The whole run lives in two steps.
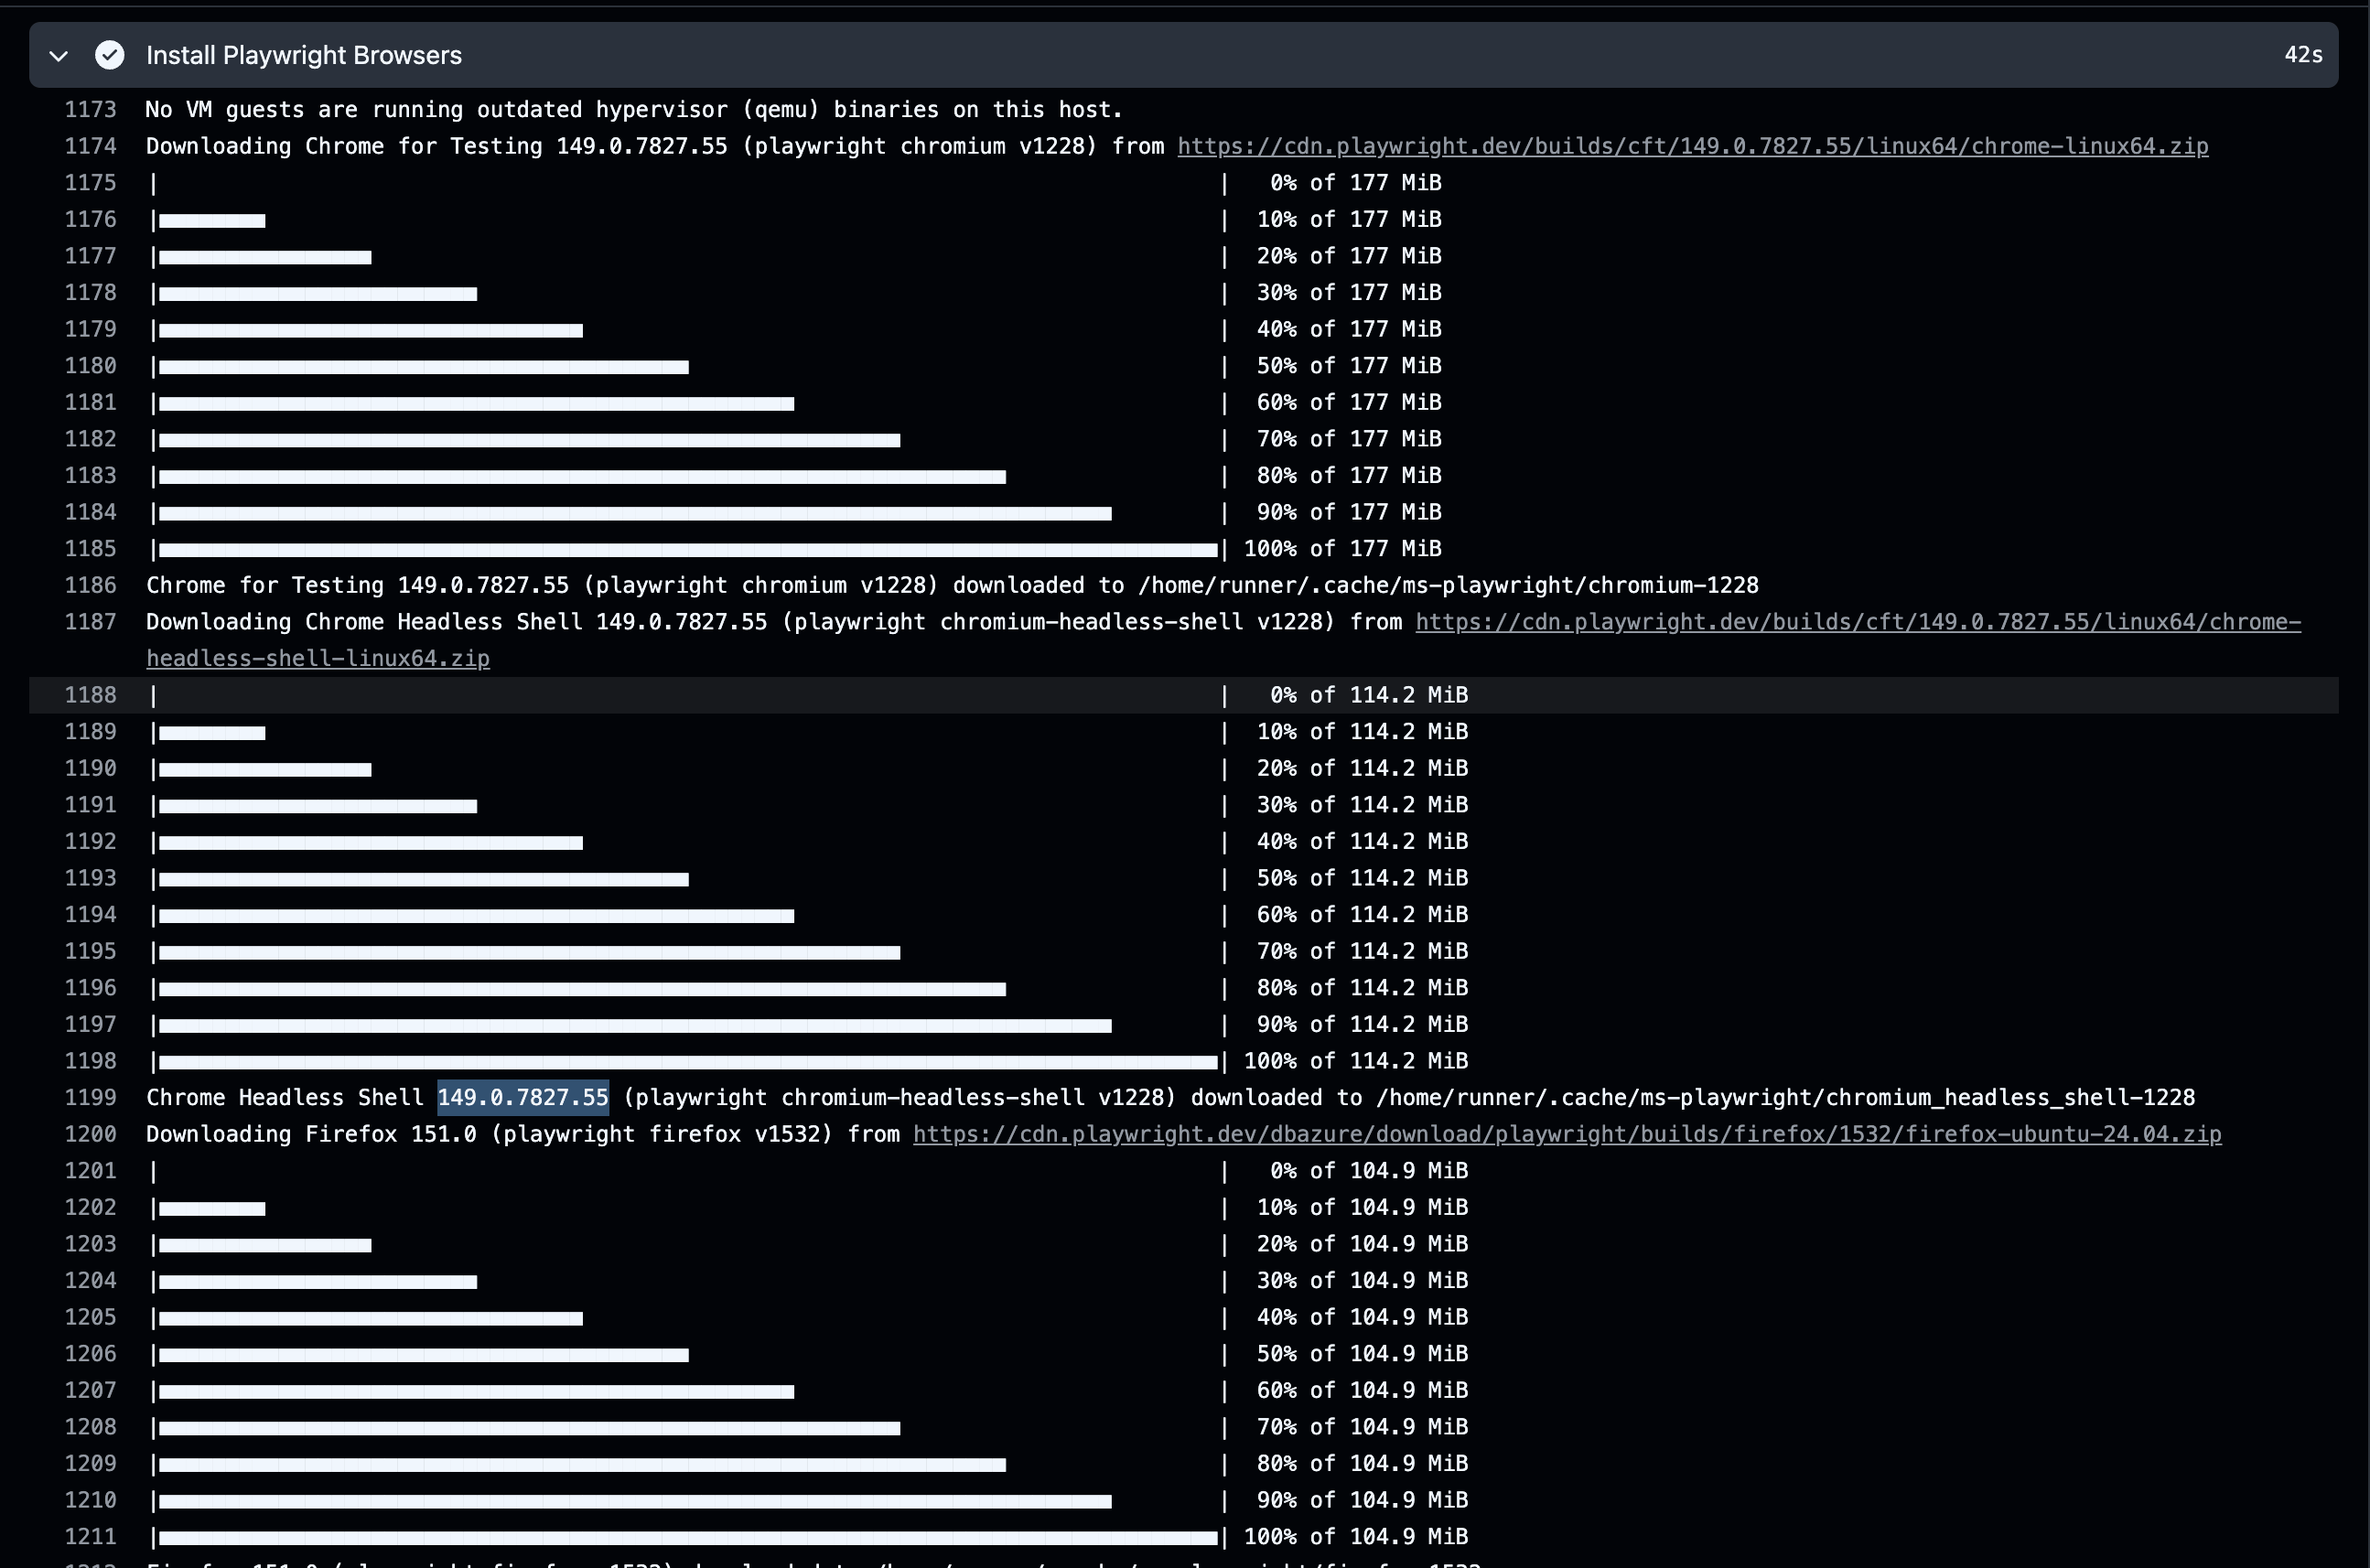
The first is Install Playwright Browsers, at 42 seconds. This step downloads Chromium, Firefox, and WebKit, plus the system libraries the browsers need, and it does this on every single run whether or not those browsers changed. Expand the step and you can watch the binaries come down:
The second is Run Playwright tests, at two minutes and 25 seconds. That is the
bigger number, and for a 40-test suite, it is far longer than it should be. The
reason is parallelism, or the lack of it. The generated playwright.config.ts
sets workers: process.env.CI ? 1 : undefined, which means exactly one worker
in CI. The tests run close to one after another even though the runner has cores
to spare.
So the two bottlenecks are sitting right there in the second screenshot, and they are independent of each other. One is repeated download overhead, fixable by caching the binaries. The other is serial execution, fixable by turning on parallelism. The next two sections take them in that order.
Worth keeping in mind as you go: the unit test speed everyone obsesses over is rarely what makes a pipeline slow. The setup and orchestration around the tests is, and that is exactly what these two fixes attack.
Speed fix 1: cache the browser binaries
The install step in the baseline took 42 seconds because the runner pulled close to 400 MB of browser binaries before a single test ran. Those binaries only change when you change your Playwright version, so downloading them on every push is work the runner repeats for no reason. Cache them once and every later run restores them instead of downloading, which turns that 42 second step into a few seconds on every PR until your Playwright version moves.
Playwright installs its browsers to ~/.cache/ms-playwright, which on the Linux
runner resolves to /home/runner/.cache/ms-playwright. You saw that exact path
at the end of each download line in the baseline screenshot. That directory is
what you cache.
Key the cache to a hash of package-lock.json. The lockfile is a convenient
proxy for your Playwright version, not a perfect one; updating Playwright
changes the hash and correctly turns the cache over, but so does any unrelated
dependency edit, which forces a cache miss you did not strictly need. For most
repos, that occasional extra slow run is a fair trade for a one-line key.
Now the detail most guides miss, and the reason a cached setup can pass review
and then break in CI. The cache stores the browser binaries but not the
operating system libraries they need to run, because those are installed
system-wide with apt and never land in ~/.cache/ms-playwright. So on a cache
hit the binaries are present but the system libraries are missing, and tests
fail with Host system is missing dependencies to run browsers. The fix is to
still install those libraries on a cache hit, just without the browser download.
On a cache hit, actions/cache restores ~/.cache/ms-playwright automatically
at the start of the job, so the binaries are already back on disk before any
install step runs.
That gives you two conditional steps, and they run on every single execution,
not just the first. On a cache miss, playwright install --with-deps downloads
the browsers and the system libraries together, in one step, and that branch
only fires again when the cache key changes. On a cache hit, playwright install-deps runs instead, every time, and installs only the system libraries.
It is not a one-off step you run once and skip forever after. apt still has to
confirm the packages are present on every fresh runner, since each job starts
from a clean machine with nothing installed, but it is fast because there is no
download involved, just a dependency check that is already satisfied for
everything but the libraries themselves.
This assumes the runner has normal access to apt’s package mirrors; on a restricted-network or self-hosted runner, confirm that access first.
steps:
  - name: Cache Playwright browsers
    id: playwright-cache
    uses: actions/cache@v6
    with:
      path: ~/.cache/ms-playwright
      key: ${{ runner.os }}-playwright-${{ hashFiles('package-lock.json') }}

  - name: Install Playwright browsers and system dependencies
    if: steps.playwright-cache.outputs.cache-hit != 'true'
    run: npx playwright install --with-deps

  - name: Install OS dependencies for browsers
    if: steps.playwright-cache.outputs.cache-hit == 'true'
    run: npx playwright install-deps
The id on the cache step is what lets the two install steps read cache-hit
and pick a branch. The first run misses, downloads everything, and populates the
cache. Every run after that hits it and skips the download, and because the key
is tied to the lockfile, the whole thing reinvalidates itself when you upgrade
Playwright with nothing to update manually.
One alternative skips caching entirely: run the job inside the official
Playwright Docker image, mcr.microsoft.com/playwright, which ships with the
browsers and OS packages preinstalled, though you still install the Playwright
package yourself. The tradeoff is pulling that large image on each job, so you
are trading the browser download for an image pull rather than removing it. It
is a common choice for visual regression work, where consistent rendering
matters, but it is built for trusted test targets, not untrusted sites. For most
suites the cache is lighter.
Caching takes the install step off the critical path after the first run. That leaves the bigger number from the baseline, the two minute and 25 second test run, which the next section deals with.
Speed fix 2: run tests in parallel with workers
Caching took the install step off the critical path, but the larger number from the baseline is still sitting there: two minutes and 25 seconds for 40 tests, running close to one after another. That serial run is not Playwright being slow; it is Playwright doing exactly what the generated config told it to do.
The line responsible is in playwright.config.ts:
workers: process.env.CI ? 1 : undefined,The scaffold sets this deliberately, on the theory that one worker is the safe default for an unknown CI environment. The cost is that it forces every run in CI down to a single worker no matter how many cores the runner actually has, which is why the baseline crawled.
Locally the value is undefined, which tells Playwright to use 50% of the
available cores rather than a fixed number. That is simply the scaffold’s
default for a local machine, not a universal optimum, and it is worth treating
it as a starting point rather than a setting to leave alone. If your local
machine has more cores to spare, or your suite is light enough to push higher
without issue, you can override undefined with an explicit number or
percentage locally too, the same way the next part of this section does for CI.
There are two changes that matter here, and they do different things. The first
is fullyParallel: true. By default Playwright runs separate test files in
parallel but runs the tests inside any one file in order. If your suite is
spread across many files, that default already keeps workers busy. But if it is
concentrated in a few large files, file-level parallelism alone leaves most
workers idle, and fullyParallel is what fixes that, by letting tests within a
single file run across workers too. The second is replacing the hard one-worker
cap with a percentage-based worker count, so CI scales with the cores it has
instead of being pinned to one.
export default defineConfig({
  fullyParallel: true, // top-level, applies to every project
  workers: process.env.CI ? "50%" : undefined, // top-level, not inside a project
  // your existing keys stay as they are:
  use: {/* ... */},
  projects: [/* chromium, firefox, webkit */],
});
Both keys sit at the top level of defineConfig, alongside use and
projects, not nested inside any one project, so they apply across your whole
suite.
Setting CI to 50% rather than a fixed number is a reasonable starting point,
not a guaranteed best value. It scales with whatever runner you land on instead
of assuming a core count, but the right number still depends on your runner and
how much memory your tests use, so measure before you raise it. This is the part
of the original guidance worth slowing down on, because most advice you will
read assumes the wrong machine.
The assumption you will see repeated is that GitHub’s free runners are 2-core.
That is true for private repositories, but public repositories now get 4-core
Linux runners for free, and the difference changes the math completely. On a
2-core runner, undefined resolves to one worker, which means the default is
effectively serial and you have to raise it to see any parallelism at all. On a
4-core runner, the same undefined gives you two workers out of the box, with
room to push higher. The baseline run earlier was on a public repo, so the
slowness there was entirely the process.env.CI ? 1 override, not a lack of
cores.
| Runner | Cores | 50% gives you | Worth trying |
|---|---|---|---|
| Private repo, ubuntu-latest | 2 | 1 worker | Set to 2 explicitly |
| Public repo, ubuntu-latest | 4 | 2 workers | ‘75%’ or ‘100%’, then measure |
| Larger runner | 8 | 4 workers | ‘75%’ and up, more headroom |
Treat the table as a starting point rather than a prescription. Begin at 50%, look at the actual wall-clock time on your suite, and raise the value in steps until the run stops getting faster or the tests start going flaky. There is no single correct number, because it depends on your core count, how heavy your tests are, and how much memory each browser instance eats.
That last point is also the thing not to do. Pushing workers well above your
core count, say workers: 4 on a 2-core runner, does not buy you speed. Each
worker drives its own browser, and once they are contending for the same two
cores and the same RAM, you trade a faster run for memory pressure and
intermittent failures that did not exist when the suite ran serially.
With fullyParallel on and the worker cap lifted, the test run on a 4-core
runner drops from the serial baseline to roughly half, and the install step is
already cached, so the two fixes together are what pull the whole job under the
five minute mark. The next section trims it further by being deliberate about
which browsers actually run on each push.
Speed fix 3: run only the browsers you need
There is something the baseline numbers were hiding. The default config that
npm init generated does not just run your tests; it runs them against
Chromium, Firefox, and WebKit, because the scaffold defines a project for each.
So those 40 tests were actually 120 test runs on every push, once for each of
the three browser engines. A good share of that 2 minutes and 25 second test run
was the same assertions executing two extra times against browsers that rarely
surface a bug the first one missed.
If your product does not need to guarantee every browser works on every change,
a practical pattern is to tier it by event. Run Chromium on every pull request,
since that is where the feedback loop needs to be fast and where most rendering
and logic bugs show up anyway, and save the full three-browser sweep for merges
to main or a nightly schedule, where you can afford the extra time and you
actually want the cross-browser signal before code ships. Pull requests stay
quick, and you do not lose coverage, you just move it to the point where it
earns its cost.
Scoping to one browser is a single flag, --project=chromium, and you switch on
the event that triggered the run:
on:
  pull_request:
  push:
    branches: [main]

jobs:
  test:
    runs-on: ubuntu-latest
    steps:
      # checkout, setup-node, cache, and install from the earlier sections
      - name: Run Playwright tests
        run: |
          if [ "${{ github.event_name }}" = "pull_request" ]; then
            npx playwright test --project=chromium
          else
            npx playwright test
          fi
On a pull request this runs Chromium alone. On a push to main it falls through
to npx playwright test, which runs every project in your config. This keeps
everything in one job, which is consistent with the single-runner approach the
rest of this piece is built on.
None of this affects local runs; the conditionals key off the CI event, so npx playwright test on your machine still runs the full browser set as before.
If you would rather have the three browsers run as separate parallel jobs on
main instead of sharing workers in one job, a conditional matrix does that:
jobs:
  test:
    runs-on: ubuntu-latest
    strategy:
      fail-fast: false
      matrix:
        project: ${{ github.event_name == 'push'
          && fromJSON('["chromium", "firefox", "webkit"]')
          || fromJSON('["chromium"]') }}
    steps:
      # same setup steps
      - run: npx playwright test --project=${{ matrix.project }}
A push to main fans this out into three jobs, one per browser, while a pull
request collapses to a single Chromium job. The trade is more CI minutes on
main, so it is worth it when the full sweep is slow enough that running the
browsers in parallel saves real wall-clock time. It stays bounded at three jobs,
so it does not drift into the open-ended job-splitting that sharding involves.
Whether the full matrix is worth running at all comes down to your users. If a
meaningful share are on Safari or Firefox, or the product is layout-heavy, keep
it on main. If they are almost all on Chromium-based browsers, nightly is
enough. One caveat on WebKit: The build Playwright runs on Linux tracks WebKit’s
main development branch, often ahead of what Apple has shipped in Safari, and it
lacks Apple’s own platform integrations. A green Linux WebKit run is a good
signal for layout and JavaScript bugs, but it is not proof the page looks right
in Safari. When that distinction matters you need macOS runners, which is a
separate decision from this workflow.
With Chromium-only on pull requests layered on caching and parallelism, each PR now runs a third of the test executions it started with, on cached browsers, across multiple workers. That combination is what holds a hundred-test suite under five minutes. Next is making sure that when something fails, you can see why, which means getting the HTML report off the runner before it disappears.
Uploading the HTML report as a GitHub Actions artifact
Playwright generates an HTML report on every run, but on a CI runner that report is written to a machine that gets torn down the moment the job ends, so by default it vanishes with the runner and you never see it. Many teams discover this on their first failing CI run, when they go looking for the detail behind a red X and find there is nothing left to open. The fix is to upload the report as an artifact before the job exits, which the baseline workflow was already doing, and to add a second reporter that surfaces failures without making you download anything at all.
The upload itself is one step, and the path that matters is
playwright-report/, which is where Playwright writes the HTML report by
default:
steps:
  - name: Upload Playwright report
    uses: actions/upload-artifact@v7
    if: ${{ !cancelled() }}
    with:
      name: playwright-report
      path: playwright-report/
      retention-days: 14
The if: ${{ !cancelled() }} condition is doing real work here. Without it, the
step only runs when everything before it passed, which is exactly backwards,
since the run you most want the report for is the one that failed. This
condition uploads the report whether the tests passed or failed and skips it
only when you manually cancel the job. On retention-days, 14 is a sensible
default for active development where you are mostly looking at recent runs, and
30 is worth setting on release branches where you may need to come back to a
build weeks later. Either way the artifact stops counting against storage once
it expires.
The artifact gives you the full report, but it costs a few clicks: download the
zip, unzip it, and serve it locally, because opening the HTML file directly will
not work. The report loads its data over HTTP, so you need npx playwright show-report path/to/playwright-report, which spins up a local server and opens
it properly. That round trip is fine when you need to dig into a trace, but it
is more friction than most failures deserve.
This is where the second reporter comes in. Playwright ships a github reporter
that writes failures as inline annotations directly in the GitHub Actions UI, so
a failed assertion shows up on the run summary and against the offending line in
the diff, with no download in the loop. You add it alongside the HTML reporter
rather than replacing it, so you keep the full report for deep investigation and
get the inline view for the common case:
export default defineConfig({
  reporter: [["html"], ["github"]],
  // ... rest of your config
});
With both in place, a failed run annotates the summary with what broke and where, and the full HTML report is still attached as an artifact for the times you need the trace, screenshots, and step timeline. That combination is what makes a failure actually readable: most of the time you never leave the GitHub tab, and the zip is there waiting when a particular failure needs more than the annotation can show.
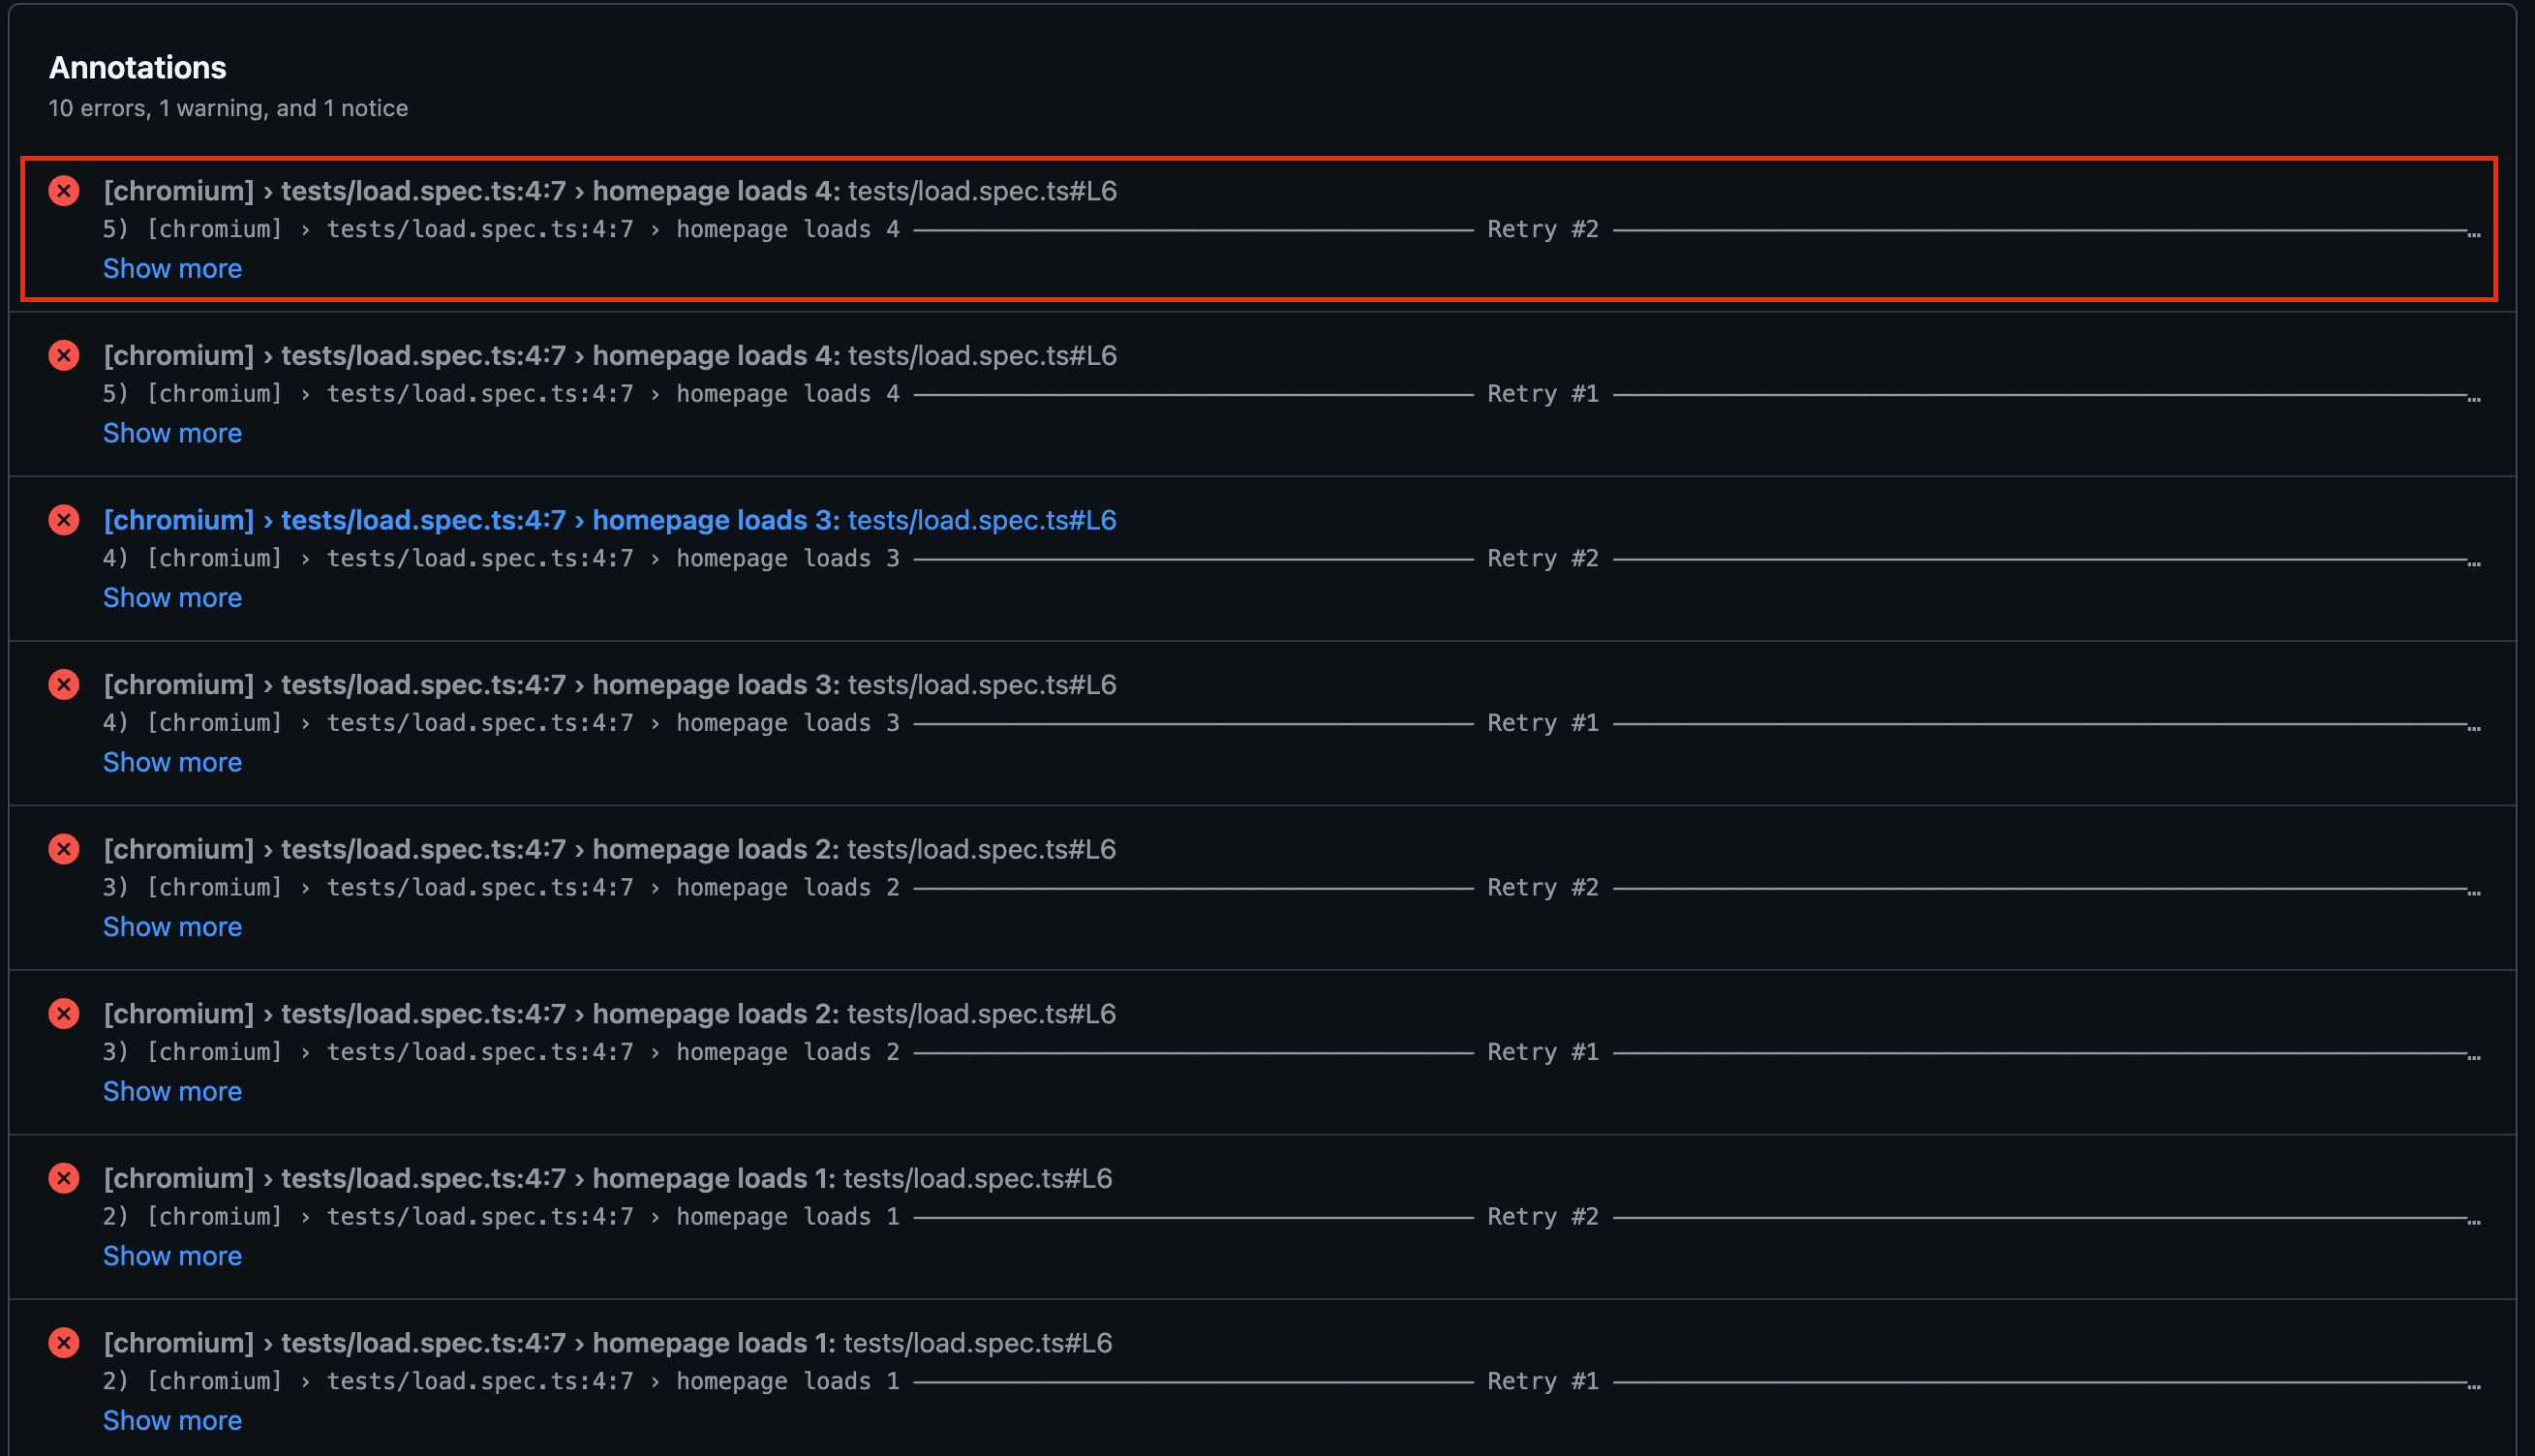
That is the pipeline producing a usable failure report every time. The next section assembles everything so far into one workflow file you can drop straight into a github repository.
A complete production-ready workflow
Everything from the last four sections lives in two files. The worker count,
fullyParallel, and both reporters belong in playwright.config.ts, while
caching, the Chromium-on-PR split, and the artifact upload belong in the
workflow YAML. Here are both, annotated inline so you can see what each block
does and adapt it to your own repo.
playwright.config.ts:
import { defineConfig, devices } from "@playwright/test";

export default defineConfig({
  testDir: "./tests",
  fullyParallel: true, // parallelize tests within a file, not just across files
  forbidOnly: !!process.env.CI, // fail the build if a stray test.only is committed
  retries: process.env.CI ? 2 : 0, // retry flaky tests in CI only
  workers: process.env.CI ? "50%" : undefined, // scale workers to the runner; measure and raise from here
  reporter: [
    ["html"], // full report, uploaded as an artifact
    ["github"], // inline annotations on the run summary
  ],
  use: {
    trace: "on-first-retry", // capture a trace when a test retries, for debugging failures
  },
  projects: [
    { name: "chromium", use: { ...devices["Desktop Chrome"] } },
    { name: "firefox", use: { ...devices["Desktop Firefox"] } },
    { name: "webkit", use: { ...devices["Desktop Safari"] } },
  ],
});.github/workflows/playwright.yml:
name: Playwright Tests
on:
  pull_request:
    branches: [main]
  push:
    branches: [main]

jobs:
  test:
    timeout-minutes: 60
    runs-on: ubuntu-latest
    steps:
      - uses: actions/checkout@v7

      - uses: actions/setup-node@v7
        with:
          node-version: lts/*
          cache: "npm" # caches ~/.npm, the safe npm cache, not node_modules

      - name: Install dependencies
        run: npm ci

      # Cache the browser binaries. This assumes npm; the lockfile is a proxy for the
      # Playwright version, so it usually turns over when you update Playwright.
      - name: Cache Playwright browsers
        id: playwright-cache
        uses: actions/cache@v6
        with:
          path: ~/.cache/ms-playwright
          key: ${{ runner.os }}-playwright-${{ hashFiles('package-lock.json') }}

      # Cache miss: download browsers and system libraries together
      - name: Install browsers and system dependencies
        if: steps.playwright-cache.outputs.cache-hit != 'true'
        run: npx playwright install --with-deps

      # Cache hit: binaries are restored, but system libraries still need installing
      - name: Install OS dependencies for browsers
        if: steps.playwright-cache.outputs.cache-hit == 'true'
        run: npx playwright install-deps

      # Chromium only on PRs for fast feedback; the full browser set on merges to main
      - name: Run Playwright tests
        run: |
          if [ "${{ github.event_name }}" = "pull_request" ]; then
            npx playwright test --project=chromium
          else
            npx playwright test
          fi

      # Upload the report whether tests pass or fail, so failures are never lost
      - name: Upload Playwright report
        uses: actions/upload-artifact@v7
        if: ${{ !cancelled() }}
        with:
          name: playwright-report
          path: playwright-report/
          retention-days: 14
Drop both in, push, and the first run populates the cache while every run after it skips the download.
If your tests need configuration like a base URL or an API token, pass it
through the test step with an env block. Non-sensitive values can go straight
in the workflow, while anything secret should be stored as a repository secret
and referenced rather than written in the file:
steps:
  - name: Run Playwright tests
    env:
      BASE_URL: https://staging.example.com
      API_TOKEN: ${{ secrets.API_TOKEN }}
    run: # ... as above
That is the whole setup, and for a suite up to roughly 100 tests it is where you stop. The next section is about knowing when you have actually outgrown it, so you can reach for sharding deliberately rather than by default.
When to add sharding (and when not to)
Sharding splits your test suite across several CI jobs that run in parallel, each handling a slice of the tests, with a final step that merges their reports back into one. It is the standard answer to a slow Playwright suite, and it works, but it solves a problem you do not have until a single runner genuinely cannot keep up. Everything to this point has been about making that single runner fast, and for most suites that is the whole job.
The decision rule is straightforward. Start with workers and fullyParallel, tune the worker count to your runner, and measure the best single-runner time. If you have maxed that out and still need more speed, try a bigger runner before sharding: an 8 or 16-core GitHub-hosted runner gives you more workers without the merge-reports step or shard-count maintenance. Only reach for sharding when one runner, even a larger one, cannot finish inside your PR review window, often around five minutes. The numbers below are a rough starting point, not a fixed rule. Where your own breakeven falls depends on test duration, runner hardware, and how heavy your suite is, not just test count.
| Suite size | Single-runner time | What to do |
|---|---|---|
| Under 50 tests | Well under 5 min | Workers and fullyParallel are plenty |
| 50–200 tests | Around 3 to 5 min | Move to a bigger runner before you shard |
| Over 200 tests, or 10+ min | Past your PR window | Shard, or move the run off your own CI |
A suite of heavy end-to-end flows hits that ceiling sooner than the same count of light page checks, since run time is what actually matters.
What sharding buys you is wall-clock time, by running those parallel slices at once. What it costs is real: more CI minutes since you are paying for several runners per run, a merge-reports step to stitch the separate reports together, and a shard count you have to revisit as the suite grows, because a split that balanced four ways last quarter may not balance well once the suite doubles. None of that is prohibitive, but it is maintenance you take on deliberately, not a default next step the moment a run feels slow.
It is also worth knowing that sharding is not the only way past the single-runner ceiling. You can skip the shard-management overhead entirely by running the suite on infrastructure built to parallelize it for you, which trades the YAML complexity for an external service. That is how Lovable runs more than 3 million Playwright tests a week with no shard count to maintain. Whether that is the right call depends on how much you want to own the CI plumbing yourself. Our Endform vs. Currents comparison weighs that against orchestrating tests across your own runners.
The main takeaway is that sharding may not always be the best solution. A single fast runner is the correct setup for the large majority of suites, and the point to add sharding is the point your own numbers cross the line above, not a moment sooner. The Playwright sharding docs cover the mechanics for when you get there.
Common setup mistakes and how to avoid them
Most of these waste an afternoon rather than break anything outright, and every one follows from a default that looks reasonable until it isn’t. The four that come up most:
-
Installing browsers without
--with-deps. Runningnpx playwright installalone fetches the binaries but not the system libraries they depend on, and GitHub runners do not ship those by default. Tests fail with a “Host system is missing dependencies” error that says nothing about the cause. Use--with-depson a cache miss andinstall-depson a cache hit, as the caching section lays out. -
Caching
node_modulesinstead of the npm cache. This is a separate cache from the browser binaries covered earlier, it is for your npm packages, not Playwright. A restorednode_modulescan carry platform-specific or partially built dependencies that do not match the runner, which surfaces as subtle, hard-to-trace failures. Cache~/.npminstead, by settingcache: 'npm'on thesetup-nodestep (the complete workflow above already does this), and letnpm cirebuildnode_modulescleanly each run. -
Setting workers too high for the runner. More workers stops helping once they outnumber the cores, and past that point the browser instances contend for the same CPU and memory, trading speed for flakiness that did not exist serially. Scale workers to the runner and raise the count only as far as your measurements stay stable.
-
Forgetting the
githubreporter. Without it, a failed run tells you something broke but not what, leaving you to download and unzip the artifact to find out. Adding['github']alongside['html']puts the failure inline on the run summary, so the common case never needs the zip.
Wrapping up
A fast Playwright pipeline on GitHub Actions does not require sharding. The two fixes that carry the most weight, caching the browser binaries and optimizing parallelism for your CI runner, are both configuration changes you can make in an afternoon, and once they are in place they pay off on every single PR rather than once. That is the quiet advantage of fixing setup over chasing test speed: the saving compounds across every run the team makes from that point on.
The single-runner setup from the complete workflow holds for a good while as a suite grows, and the honest framing matters here. When a team does outgrow it, that is a scaling decision to make on purpose when the numbers cross the line, not evidence that something was done wrong along the way. Reaching for sharding too early is its own kind of mistake, paying in complexity for time you were not going to lose.
Underneath all of it is one idea worth keeping in view. The test suite exists to give fast, trustworthy feedback on every push, and every fix in this piece, from the cache key to the worker count to the inline reporter, is in service of that. A pipeline that returns a clear answer in a few minutes is one people actually trust and wait for. A slow or noisy one gets ignored, which quietly defeats the reason you wrote the tests at all.
If your suite has crossed that line and you do not want to own shard counts, matrix jobs, and report merging, Endform gives you the same parallelism without the CI plumbing. The GitHub Actions setup guide takes a few minutes.