
You are probably here because you’ve experienced the pain of a slow end-to-end test suite. You’ve been stuck in a pipeline waiting to ship a critical bug fix. You can see your team’s frustration, and what it’s costing them.
End-to-end tests should be speeding you up, not slowing you down. So where do we go from here? How do we maintain deployment confidence while improving the speed of the suite?
Even though Playwright is the most performant end-to-end testing framework out there, it’s not immune to slow tests.
Today, we’re going to take a step back together and diagnose your Playwright end-to-end test suite. We will try to boil your speed problems down to one of the following three categories:
- Test design and structure
- Slow systems under test
- Browser-based bottlenecks
Test design and structure
Extending existing end-to-end tests is almost always going to be easier than writing new ones from scratch. When suites evolve over time, it’s normal to have some level of scope creep and overlap. Let’s see if we can spot some of that in your test suite.
Start with a run of your test suite:
➜ npx playwright test
  ✓  1 [setup] › tests/setup.spec.ts:3:5 › setup (50ms)
  ...
  ✓  28 [chromium] › analytics.spec.ts:4:5 › Analytics tables are displayed (6.4s)
  ✓  29 [chromium] › analytics.spec.ts:79:5 › Can add filters with each table type (8.1s)
  ✓  30 [chromium] › concurrency.spec.ts:3:5 › Can set concurrency limit (56s)
The default Playwright reporter gives us a great place to start investigating. Next to each test name, you’ll see a bracket showing how many seconds the test takes to run. In our experience:
- 10 seconds is very good
- 20-30 seconds is fair, but getting quite long
- 60+ seconds is cause for concern
Start from the slowest tests, and the tests most closely related to them:
- Do the assertions match the spirit of the test name?
- Are there parts of the test that don’t necessarily test what’s most important?
- Can you see common patterns used in other tests to get to this point?
Using test steps for better intent visibility
As an extra exercise, start refactoring a few tests to use Playwright’s test.step() annotations.
This can help you debug tests later on and might make common steps more obvious.
test('user can complete checkout process', async ({ page }) => {
  await test.step('Login as existing user', async () => {
    await page.goto('/login');
    await page.getByRole('textbox', { name: /email/i }).fill('user@example.com');
    await page.getByRole('textbox', { name: /password/i }).fill('password123');
    await page.getByRole('button', { name: /sign in|login/i }).click();
    await page.waitForURL('/dashboard');
  });

  await test.step('Add items to cart', async () => {
    await page.goto('/products');
    await page.getByRole('button', { name: /add to cart/i }).first().click();
    await page.getByRole('button', { name: /add to cart/i }).nth(2).click();
    await page.getByRole('button', { name: /cart|shopping cart/i }).click();
  });

  await test.step('Complete checkout', async () => {
    await page.getByRole('button', { name: /checkout|proceed to checkout/i }).click();
    await page.getByLabel(/card number|credit card/i).fill('4242424242424242');
    await page.getByLabel(/expiry|expiration/i).fill('12/25');
    await page.getByLabel(/cvc|cvv|security code/i).fill('123');
    await page.getByRole('button', { name: /complete purchase|place order/i }).click();
  });

  await test.step('Verify successful purchase', async () => {
    await expect(page.getByText(/order confirmed|purchase successful/i)).toBeVisible();
  });
});
These steps may highlight, say, that the login step is repeated in many tests.
Potential solutions
-
Split tests: In many cases, splitting up a test to undo previous scope creep is your most straightforward solution. Beware, however, that you might end up with two 40-second tests due to common setup steps.
-
Leverage APIs: Investing in creating and using APIs more in your tests will probably have the biggest impact long-term. Instead of repeatedly clicking through the browser, use API requests to create the necessary data.
If the API you need doesn’t exist, create it! Once a few tests use them, modifying and extending them for more use cases is much easier.
These APIs don’t always have to be public. Secured internal APIs might be the best option for you.
If you’re content that your tests don’t overlap too much or repeat the same steps, then it’s time to dive deeper into the timings of your test runs.
How Slow is Your Testing Environment?
Let’s flip our diagnosis on its head. Sometimes it’s not the test code that’s slowing you down, but the system you’re testing against!
To get to the bottom of this, let’s temporarily turn on Playwright traces on all runs:
// playwright.config.ts
export default defineConfig({
  // ...
  use: {
    trace: "on",
  },
  // ...
});
Then, run your tests again and open up the report with npx playwright show-report.
As with the last section, let’s start by picking the slowest tests, and opening up the traces for them.
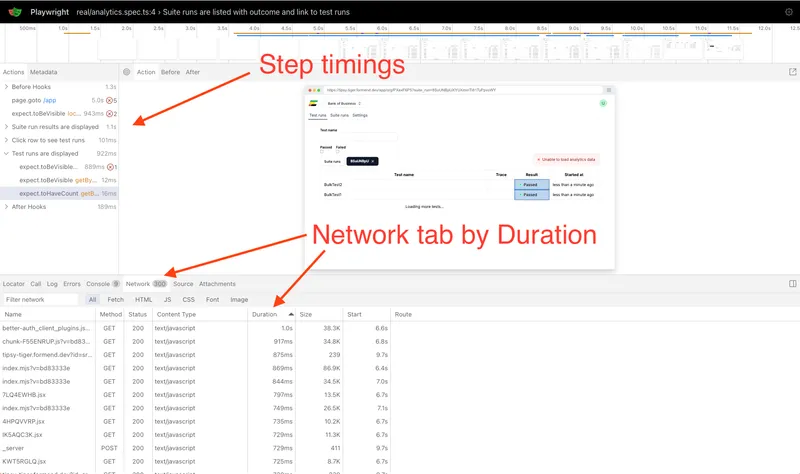
When looking at traces, the timings of the steps on the left are a starting point for where time is being spent. However, our favorite test is to look at the network tab and click on the duration field twice to organize by slowest network requests. Here, slow systems under test should start to stick out. Do you have API requests taking over a second? JavaScript that loads slower than it should?
To confirm your suspicions, you can always compare your test runs to your production values. The best observability tools should be able to give you real sampled averages of both your production and test runs to help you determine if it’s your staging environment, rather than just the test itself, that’s slowing you down. Maybe the monitoring tools you’re already using can help you out.
Potential solutions
If your testing environment is the bottleneck, fixing it might be a more significant infrastructure investment. Consider:
- Moving towards providers that support dedicated preview environments
- Ensuring you’re running fully optimized production builds with enough allocated resources
- What other parts of your infrastructure aren’t mirroring production closely enough yet (your CDN setup or database deployment)
In our experience, buying third-party solutions that offer serverless alternatives offer much better bang for your buck than building these setups in-house.
Resource constraints
If neither test design nor environment seems to be the issue, you might simply have a lot of decent tests. Congratulations! This is a sign your organization really cares about product stability.
Understanding the resource requirements
Running many browsers for end-to-end tests is resource-intensive:
-
Each browser needs about 1-1.5GB of RAM
-
Each browser uses at least one CPU core
With 100 tests, you’d need around 100GB of RAM, more than most local machines or CI environments typically have available.
Potential solutions
- Configure more workers in Playwright (default is 50% of available cores)
- Follow Playwright’s advice on parallelizing tests in CI
- Fan out Playwright tests across several GitHub actions or within your CI provider.
This is normally done by booting up multiple machines in parallel and using the
--shardflag to run a fraction of the suite on each machine.
If you’re looking for a managed, fully parallel infrastructure solution, consider our product, Endform. We can get your suite running as fast as your slowest test.
Final thoughts
If your suite got slow over a long period, it might not get faster overnight. However, taking an hour to correctly diagnose why it’s slow now can help you choose a reasonable speed increase target for your team in the coming months.
Our favorite solutions are:
- Investing in better internal APIs (not the cheapest or easiest option, but potentially the highest impact)
- Discussing with your team the cost of not having a better/faster testing environment to run against
- Using more parallel infrastructure or a managed service like Endform to run your tests
Looking for a way to convince your team to invest in this?